

John Morton
Summary
2024 was a successful year for investors, despite the slate of uncertainties at the onset and throughout. The US stock market, led by our biggest companies and concentrated in the technology sector, powered forward to a 25% gain (S&P 500 Index). With a strong US economy and stellar corporate earnings, many investors head into 2025 with optimism for continued strong returns within large cap US stocks. Other investments, including US small cap stocks, international stocks, and bonds, contributed to investor returns in 2024, just to a lesser extent. The high expectations for the S&P 500 going forward might prove difficult to achieve, however, so investors should maintain their strategic allocations and remain diversified.
The dominant investment themes for 2024 include the US election, inflation and interest rates, and the Artificial Intelligence surge (not bubble, yet).
US Election
A recap of 2024 would be inadequate without mentioning the US presidential election. As a backdrop: the US economy has had a very successful four years coming off of pandemic lows, boosted by government stimulus, private sector investment, a strong US dollar, and – perhaps most importantly –robust consumer spending and healthy household finances. All of this has translated into record corporate profits and a booming stock market.
That might seem at odds with voters, who expressed discontent with economic issues. The easiest explanation is that 1) the daily finances of lower- and middle-class voters got hit hardest by stifling inflation and an affordable housing crisis and 2) the stock market is not the economy. While US economic growth has been strong over the last 4 years, earnings growth has been even better, and stock price gains even better still.
This backdrop is important, because it is the economy and stock market that President Trump has inherited. The Wall Street Journal recently compared how “expensive” US stocks were at the start of various presidencies. The measurement here is the cyclically adjusted price/earnings ratio, which is a good metric for stock market valuations because it smooths out a decade’s worth of data and adjusts for inflation. As evidenced in the chart below, US stocks are expensive.
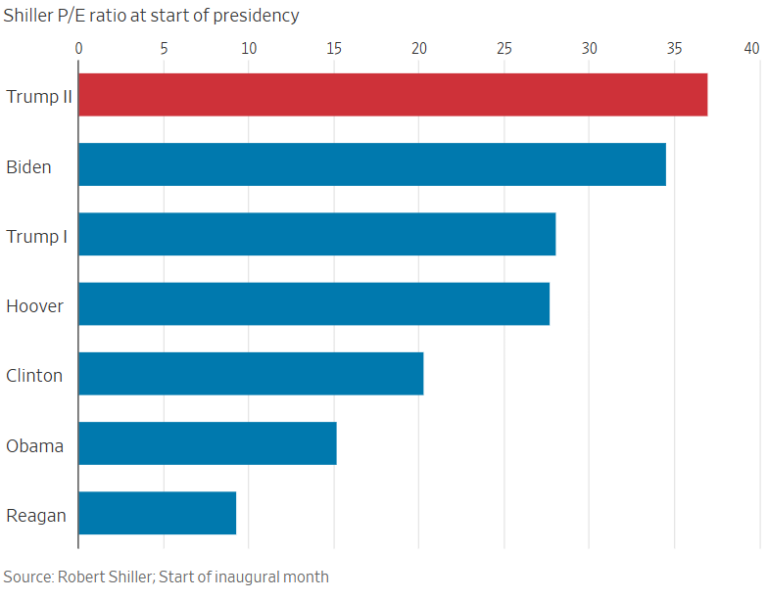
The best way to think about this might be: rather than a bar chart showing Shiller P/E ratios, imagine it’s a bar chart showing a “hurdle” that the US stock market has to jump over. For an athlete, a lower hurdle on the track means a better chance of clearing the hurdle without a faceplant and, hopefully, clocking in at faster times. Lower hurdles are easier for athletes and the stock market alike. The path to strong investor returns becomes easier when stock prices are cheaper.
A high hurdle, like the one facing the US stock market today, means that while it isn’t impossible to have strong returns over the next 1-, 4-, or even 10-year period, the difficulty level to achieve those returns is higher and, thus, less likely. If you’ve read the recent 10-year forecast of US stock market returns produced by the biggest banks and investment managers, annualized real returns predictions were frequently in single digits. At Boardwalk, we don’t put much weight into these predictions – but the consensus of a “high hurdle” for the S&P 500 over the next decade seems reasonable for many reasons.
President Trump wields a lot of power, especially with a Republican sweep in Congress. For investors, this will certainly have an impact because Trump’s priorities are more likely to become law and be implemented. From the perspective of US corporations, the market is anticipating both opportunities and risks:
-
Potentially beneficial policies: fewer regulations, improving business and consumer sentiment, and tax cuts for households and companies
-
Potentially risky policies: Immigration reform, tax cuts, and tariffs might prove to be inflationary – increasing costs and driving up interest rates
I’ll note that tax cuts are included in both bullet points because while cuts would leave more money in the pockets of households and businesses, that might just become extra spending cash, pushing up prices of goods and services (boosting inflation).
Inflation and Interest Rates
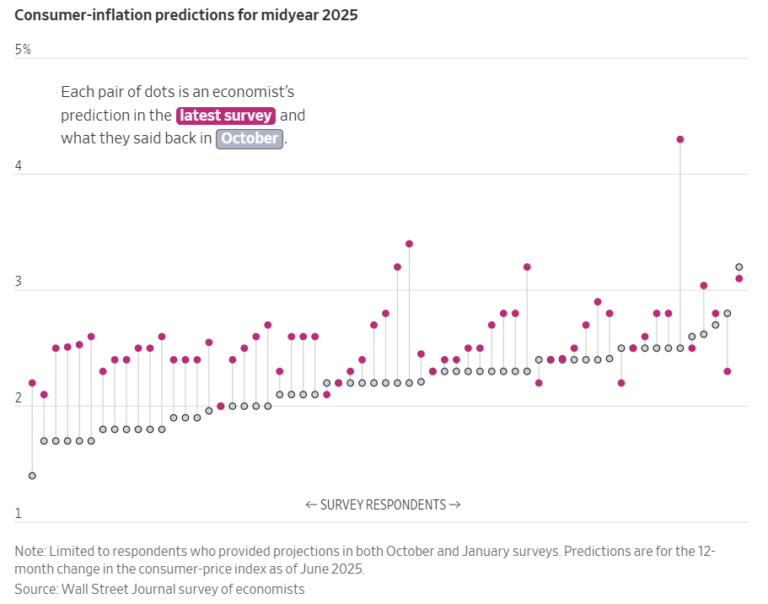
Inflationary government policies have complicated the “inflation battle” that the Federal Reserve (the Fed) has been engaged in for the last 3 years. Prior to this fall, inflation had been descending, and policymakers had lowered the high end of the Fed Funds Rate range from 5.5% to the current 4.75%. At December’s FOMC meeting, policymakers cut the Fed Funds Rate by another 0.25% but signaled a reluctance to trim rates further unless there is continued evidence that inflation remains subdued. Here’s a chart showing how economists have changed their expectations for inflation since October.
Here’s how inflation and interest rates have changed this year:
-
At the beginning of 2024, inflation (price increases) in January were measured at a 3.1% annualized clip.
-
Short-term (Fed Funds) rates started at ~5.5% and the 10-year Treasury yield stood at ~3.9%
-
-
In December 2024, inflation measured 2.9% (annualized).
-
Short-term rates ended the year at ~4.5% and the 10-year Treasury yielded ~4.6%
-
As you can see, these inflation rates are significantly below the 9.1% high from June 2022. But because of inflationary risks and a strong economy, the Fed has effectively taken on a “wait and see” approach to short-term interest rate levels.
There is a big distinction between short-term rates controlled by the Fed and long-term rates, largely determined by market forces. While short-term rates have fallen ~1%, the 10-Year Treasury yield has risen by ~0.7%. Higher long-term rates can be attributed to the market’s higher forecast of economic growth and inflation over the next 10 years. Part of the higher forecast for growth comes because of the surge in AI-related investments by big-tech firms and potential for productivity gains after further implementation within corporate America.
Artificial Intelligence
A continuation of 2023’s theme would be the dominance of the “Magnificent Seven” technology companies, their pursuit of generative AI, and implications for investors. As we wrote this summer, seven companies – Microsoft, Nvidia, Amazon, Meta, Alphabet, Tesla, and Apple – have done three things (among many more).
-
Make a lot of money.
-
These companies have produced the lion’s share of US earnings and US earnings growth over the last two years. The expectation is that the growth will continue. Earnings for Q4 will be known in the coming weeks but the market is expecting the Magnificent 7 to report earnings growth of 21.7% for Q4 (the other 493 companies are expected to grow earnings by 9.7%).
-
-
Invest a lot of money.
-
Last year, Goldman Sachs estimated that 22% of all US research and development dollars were put towards AI. Cumulatively (to date and over the next few years), the Magnificent Seven, along with other tech companies, utilities, etc. will invest about $1 trillion in capital expenditures alone for AI (in addition to indirect investments and costs too). That’s a big bet.
-
-
Become much more valuable.
-
These companies have increased in value by trillions of dollars over the last few years. As of December 31, 2024, the Magnificent Seven make up 34% of the S&P 500 Index and 55% of the Nasdaq Composite Index.
-
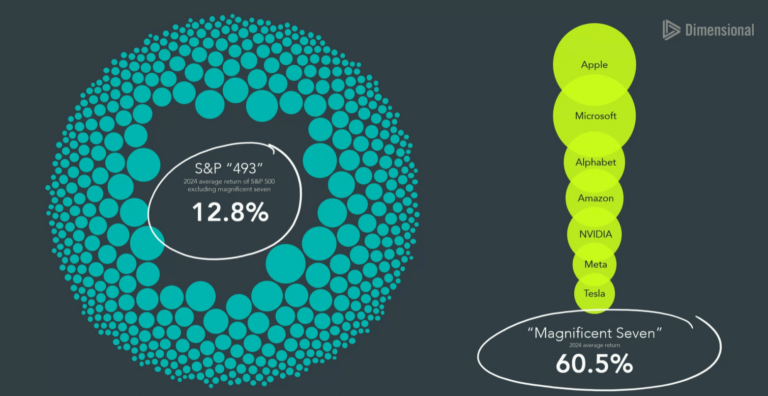
In 2024, US equity performance was dominated by the Magnificent Seven. The chart below highlights the return of the Magnificent Seven (up 60.5%) compared to the other 493 companies in the S&P 500 Index (which were collectively up 12.8%). In the chart, the weighting of each company (size relative to the index) is represented by the size of the bubbles below. If you added up the weightings of the seven tech stocks in light green, it would amount to 34% of the S&P 500 Index, which is the largest weighting in stock market history for seven companies.
Given the massive 2024 return difference, some people might wonder at this point: why would investors own anything other than the Magnificent Seven? Our answer: Just like with the illustration above (about the stock market that Trump has inherited), the Magnificent Seven have some very large hurdles to clear. Below is a chart put out by the advisors at Ritholtz Wealth Management and, while it focuses on Nvidia, the point stands: the expectations are very high for these companies.
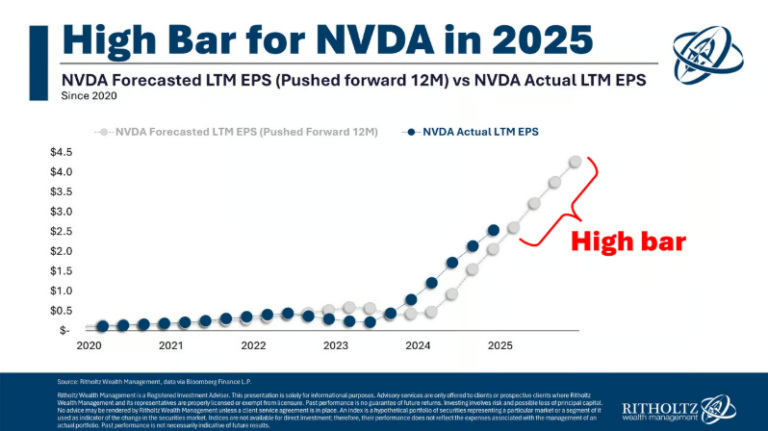
Failing to clear the “expectation hurdles” facing the Magnificent Seven could prove costly for all investors because they make up one third of the S&P 500 Index.
As an aside: We’ll also note that achieving these high expectations is not entirely in Nvidia’s control. While this quarterly commentary was written ahead of January 27th (yesterday), I do have to add an update to mention that Nvidia made news yesterday by losing $600B in market capitalization (down ~17%), the biggest one-day loss ever by a publicly traded company. The selloff wasn’t caused by missing earnings expectations (the “high bar” in the chart above) but rather a new AI model developed rather inexpensively in China by DeepSeek. The news caused an immediate repricing of Nvidia’s shares because of fears that the AI revolution might not need as many Nvidia chips as previously assumed.
How Should Investors Approach 2025?
It has been a great year for investors in US large cap stocks – and, rightly so, we should celebrate that. Heading into 2025, we think it makes sense to keep being invested in the Magnificent Seven and US stocks as a whole, despite the high hurdles ahead. We are also making sure that our clients are globally diversified and balancing their equity exposure with bonds, according to each client’s preferences and goals.
Investing based on recent performance is like driving (forward) while looking into the rearview mirror. It’s a scary way to drive and a dubious way to invest. Investment results are often cyclical, with leaders and laggards trading turns. There are countless examples we could provide where investors have done themselves a disservice by chasing returns, such as piling into internet stocks during the Tech Bubble, investing in leveraged real estate properties in the 2000s, or buying high flying, unprofitable US companies after the pandemic surge. All of these examples ended badly for investors who chased returns.
With 2025 off to a solid start, there is room for both optimism and skepticism that the bull market for US stocks can continue at the robust pace of the last two years. Our aim is to keep you on a path to achieving your goals regardless of what 2025 has in store. At Boardwalk, we are recommending that our clients maintain their strategic allocations and rebalance when necessary to follow the investing mantra “buy low and sell high.”