The first quarter of 2025 delivered its share of headline-grabbing events—from ongoing trade disputes to inflation fluctuations—causing volatility across global markets. Despite the uncertainty, diversified portfolios helped smooth the ride for long-term investors. Like a deep-sea fishing trip, it may get choppy, but staying on board remains the best way to catch your dinner.
Tariffs and Trade Tensions
The biggest market-moving story this quarter was the reemergence of tariffs. The administration introduced sweeping trade measures in early April, imposing a 10% tariff on goods from countries not retaliating against US exports, while threatening tariffs over 100% on imports from China. These moves, aimed at revitalizing US manufacturing, raised investor concerns around inflation and global economic contraction.
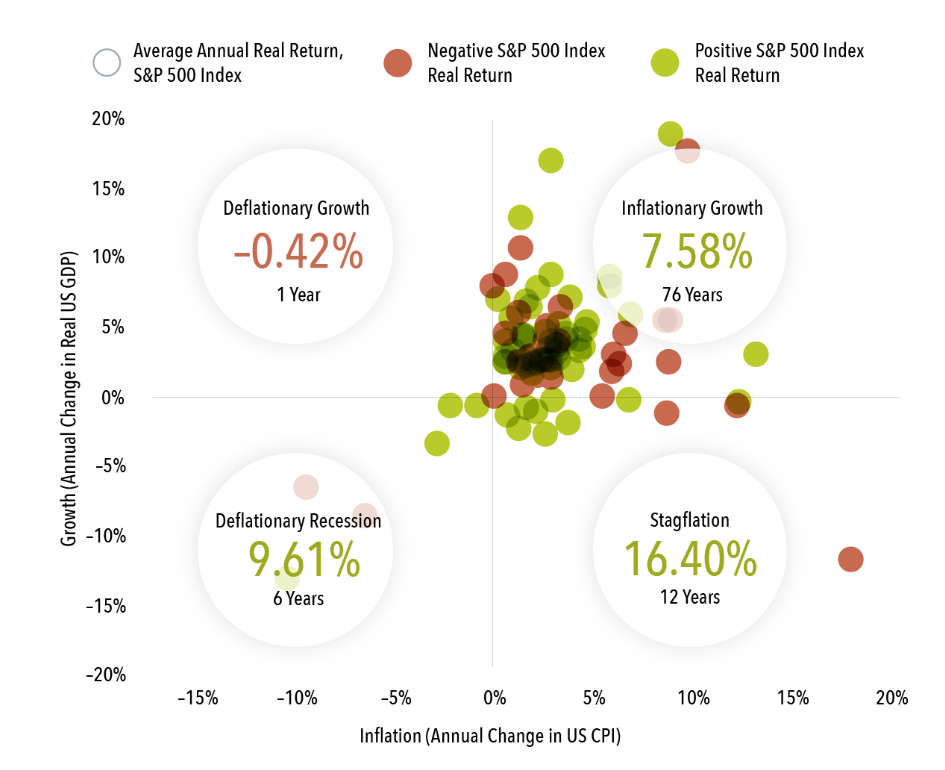
Tariffs often result in higher prices as the extra costs get passed on to US consumers. While intended to drive domestic consumption, consumers may feel the pinch in categories ranging from electronics to food. This inflationary pressure, paired with slower growth, raises the specter of stagflation—a rare but possible outcome. Historically, however, even during past stagflationary periods, markets have performed better than expected. In 9 out of 12 such years since 1930, the inflation-adjusted return on US equities remained positive.
Inflation and Interest Rates
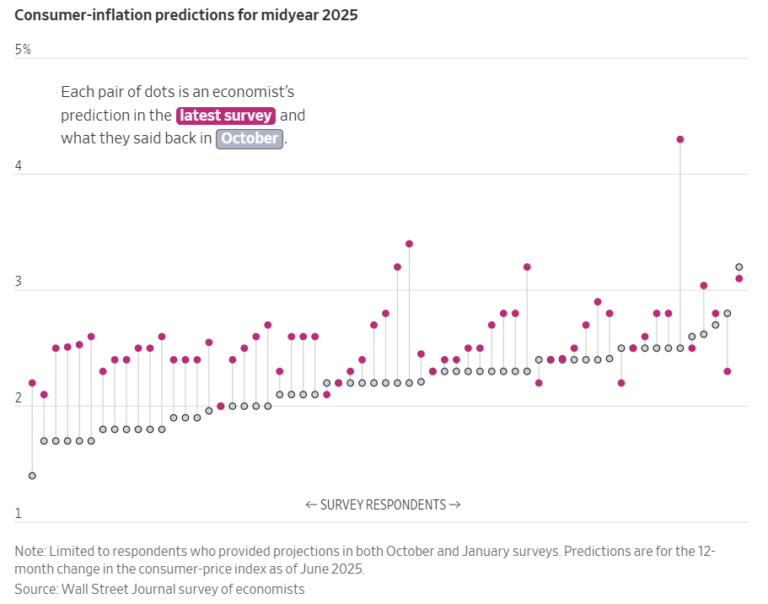
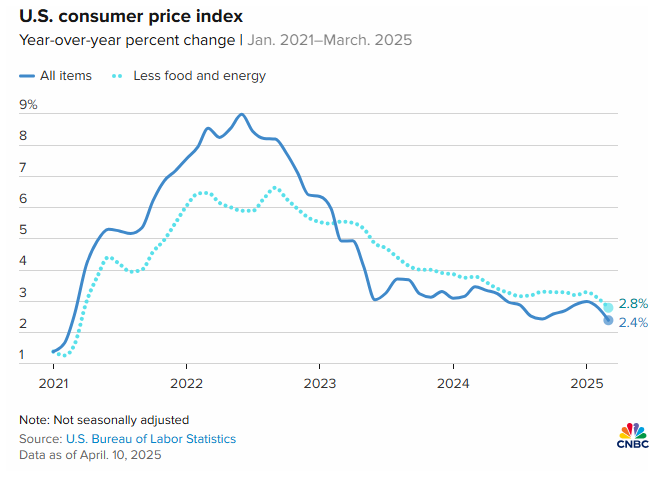
The Federal Reserve kept the federal funds rate steady at 4.25%-4.5% after their March and May meetings, citing persistent inflation and uncertainty in the economic outlook. The Core Consumer Price Index for March fell to 2.4%, down from 2.8%, but still above the Fed’s 2% target. Inflation in the coming months will depend on the labor market, consumer spending, and continued global trade dynamics.
While markets dislike uncertainty, the Fed’s cautious stance provides some clarity for investors. It signals a measured approach to rate adjustments, allowing markets to process economic data more thoughtfully.
Diversification in Action
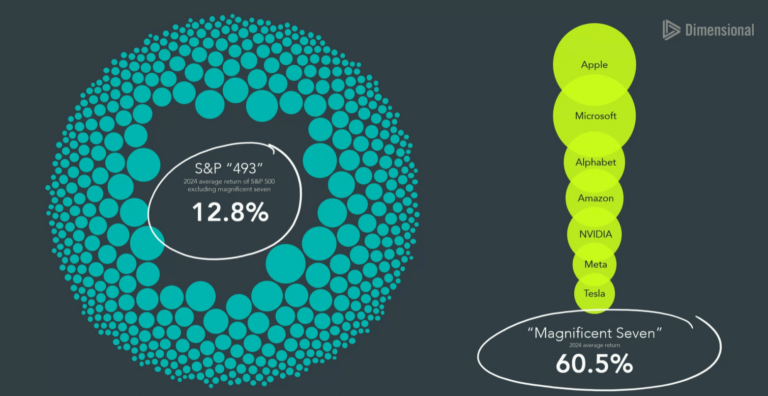
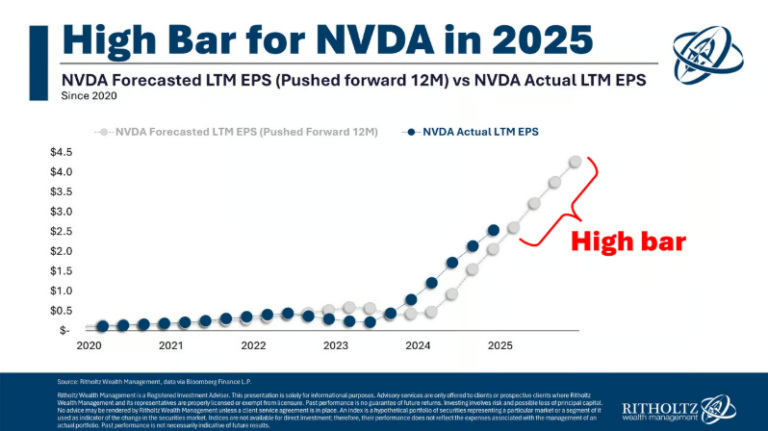
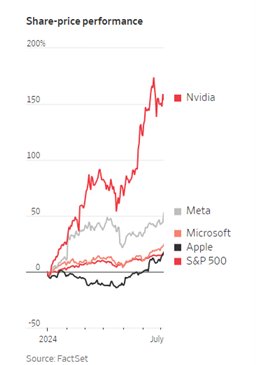
The S&P 500 ended Q1 down 4.3%, despite early-year highs. A major drag was the sharp decline in tech stocks—particularly NVIDIA, which lost nearly $600 billion in market cap in one day following disruptive AI developments in China. The swift reversal highlights the risk of concentrated positions in any single sector or company.
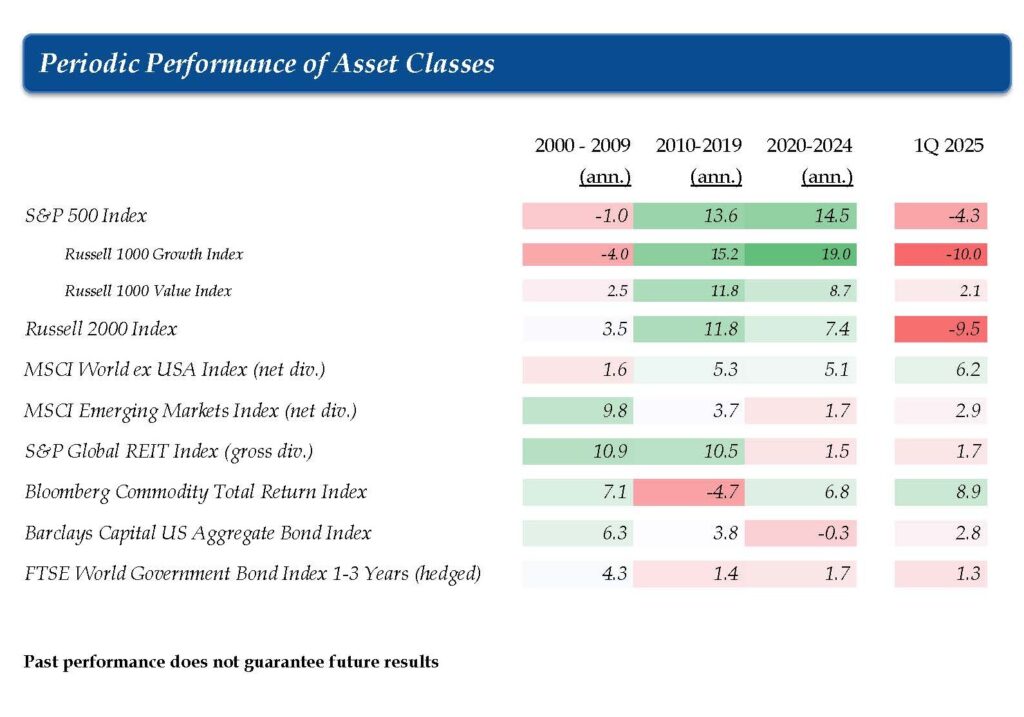
In contrast, developed international equities gained 6.2%, while emerging markets added 2.9%. Even countries impacted by US tariffs—such as China and Mexico—posted positive returns, underscoring the value of global diversification. Though US stocks have dominated the past two decades, Q1 offered a reminder that leadership rotates, and a globally balanced portfolio is key to long-term success.
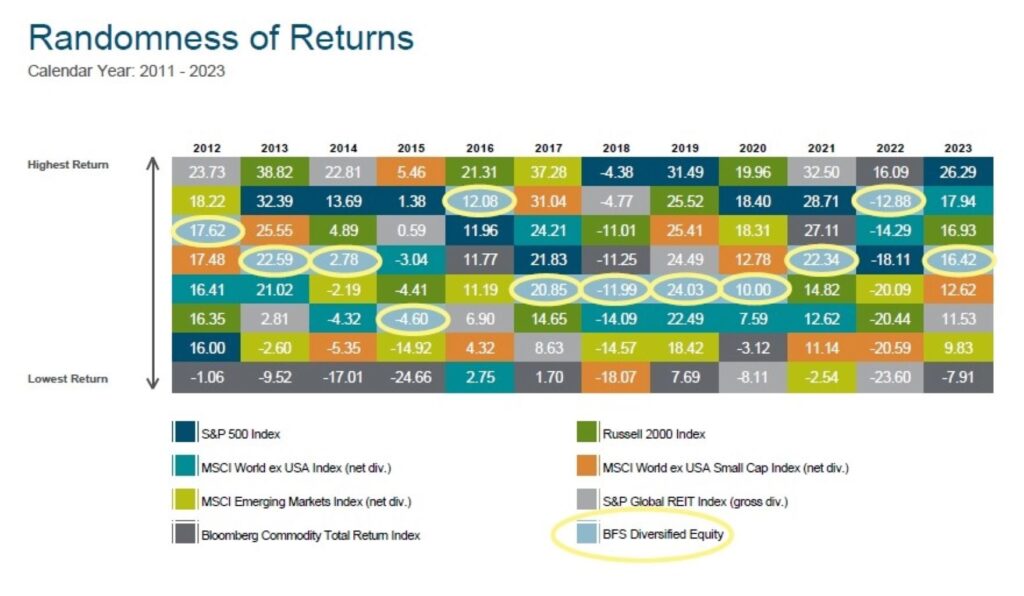
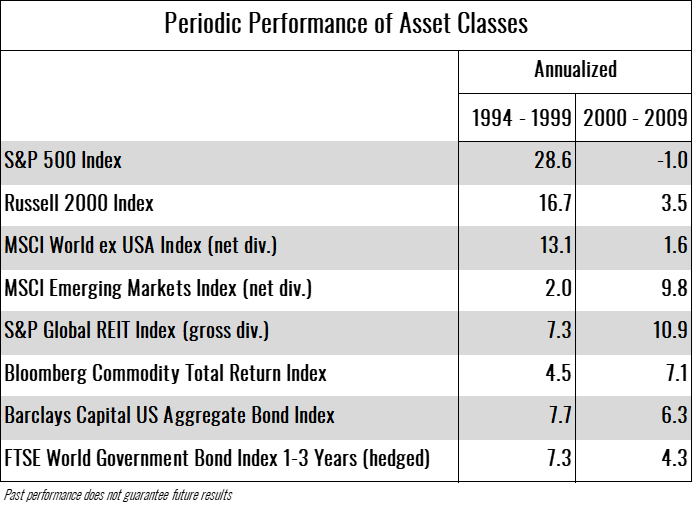
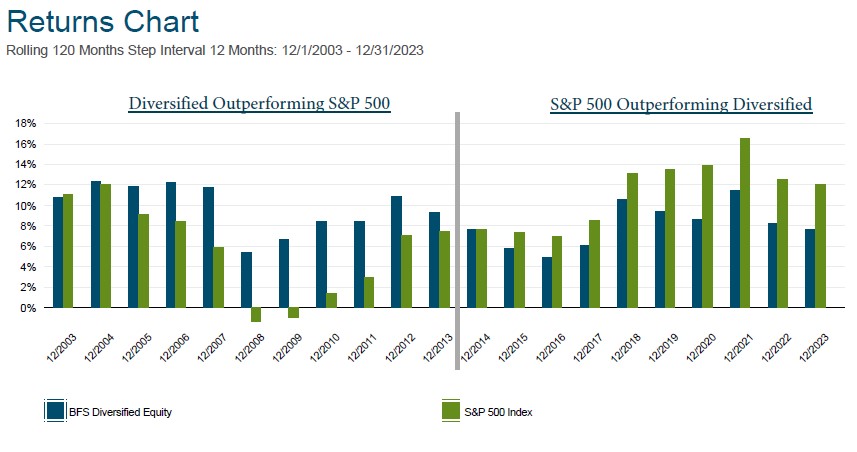
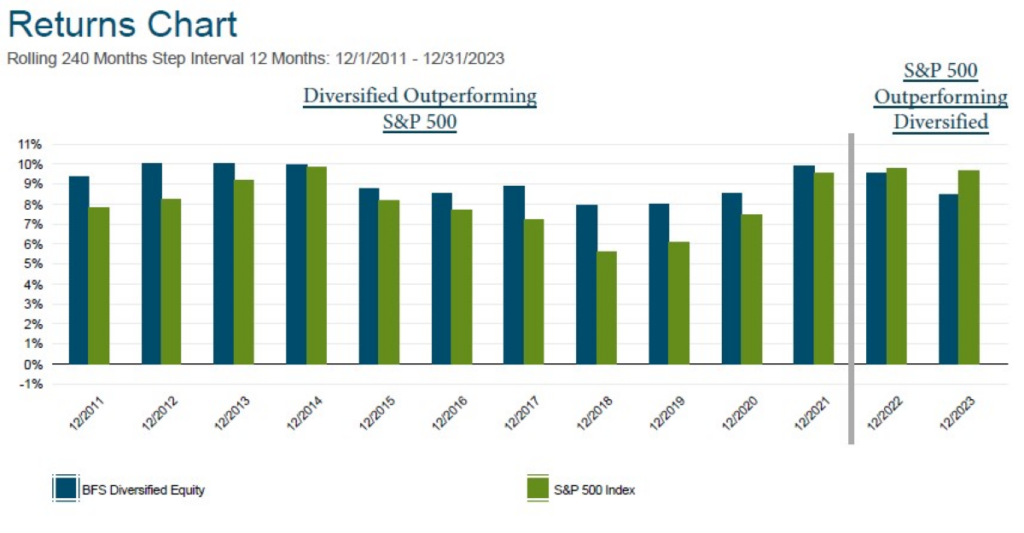
Market performance over the last two decades (shown in the table below) could have easily influenced investors to skew their portfolios toward US stocks, but the recent and sudden shift in US stock market performance is a reminder of the importance of diversification. The table below illustrates this point in a historical context, where a “lost decade” for US stocks from 2000-2009 didn’t have to be a lost decade for a diversified portfolio.
Volatility: A Normal Part of Investing
Market volatility surged this quarter, driven largely by policy uncertainty and shifting investor sentiment. April 3rd and 4th marked the worst two-day stretch for the S&P 500 since the COVID-19 crisis. However, just days later on April 9th, the market rebounded, up 9.5%—the third-largest single-day gain in the past 30 years.
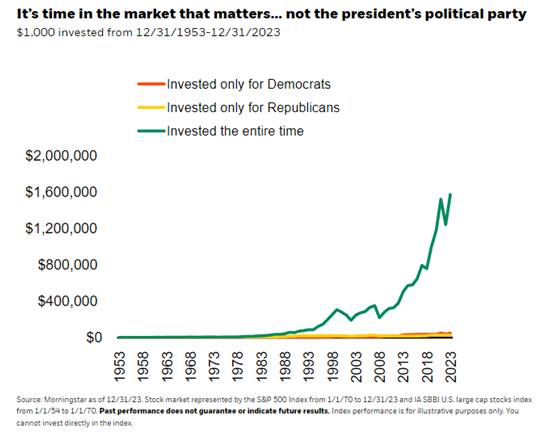
This dramatic swing reinforces a critical lesson: missing just one big “up day” can drastically reduce long-term returns. For instance, over the past 20 years, seven of the ten best days in the S&P 500 occurred within two weeks of the ten worst days. Timing the market is not only difficult—it’s detrimental to the long-term performance of your portfolio.
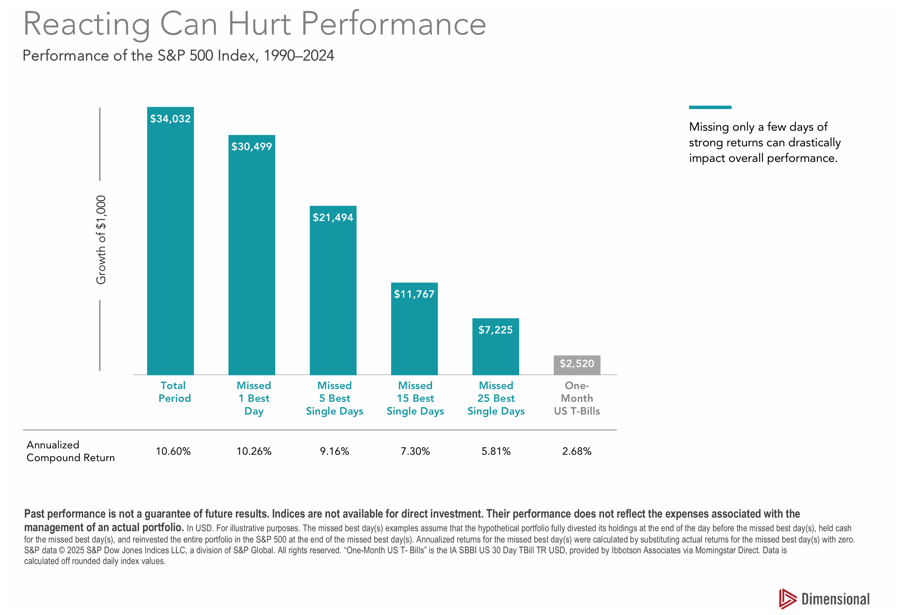
Long-term investors benefit most from staying the course. One strong day may not move the needle much over 5 or 20 years, and trying to predict that day is nearly impossible.
Staying Disciplined During Market Stress
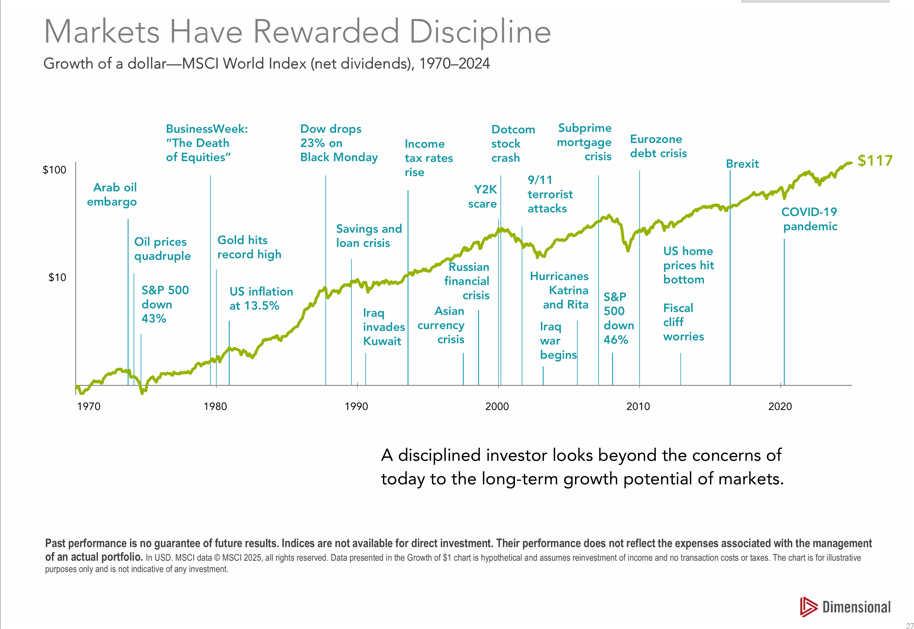
While market turbulence may tempt investors to take action, history shows discipline is the better strategy. The US has weathered the Great Depression, the 2008 recession, and the COVID-19 downturn. Markets have rewarded those who remained invested through each crisis.
We believe in the power of diversification and long-term planning. Your portfolio is built not just to endure short-term volatility but to help you pursue financial success over time. Unless your personal circumstances or goals change, your plan likely doesn’t need to. As always, if you have any questions please reach out to us.