Today’s Chances for Bad Investing Behavior: High

It has long been common knowledge that making emotional investing and money decisions can lead to poor results.  The field of behavioral finance has only more recently begun to document and quantify the impact. 

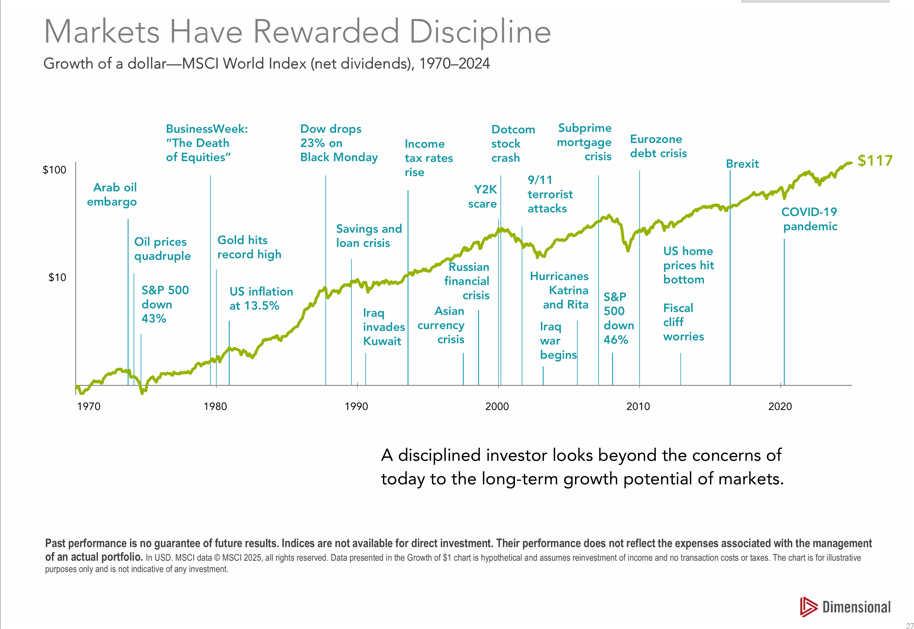
 A presidential election is always a source of uneasiness for investors.  Add to that our current backdrop of economic and geopolitical uncertainty and you get an environment fraught with opportunities to make decisions based on emotion or the behavioral biases that live within all of us.

 Therefore, I thought this might be a good time to share some of my favorite investing quotes and fun facts, in the hopes that at least one might resonate with you and help you navigate whatever negative or positive thoughts, news, or predictions come your way in the coming days, weeks, and months (and yes, years and decades as well!).

 Maintaining Discipline in the Face of Volatile Markets and Scary Headlines

Humans are hardwired to be bad at this.  Our fight or flight response kicks in during moments of fear, telling us “do something!” when, in fact, doing nothing is very likely the better approach.  This is easier said than done.  A few financial firms have attempted to quantify the impact of bad timing decisions investors make.  Vanguard estimates the “cost” of bad investing behavior at up to 2% of portfolio value per year while Russell Investments estimates the return differential at 2.54% per year.  Morningstar reports two sets of returns for mutual funds: the actual fund return and what they call “investor return.” This is Morningstar’s estimate of what end-investors actually earn based on fund inflow/outflow data.  In aggregate, their most recent measurement is that investor returns lag the actual fund returns by 1.1% per year.

A genius is the man who can do the average thing when everyone else around him is losing his mind.

Save like a pessimist and invest like an optimist.

Your success as an investor will be determined by how you respond to punctuated moments of terror, not the years spent on cruise control.

Be fearful when others are greedy, and be greedy when others are fearful.

Tuning out the Noise

This is a difficult task.  We are bombarded with information from the 24-hour news cycle, friends and colleagues, and social media.  Bad news easily catches our attention because we feel the pain of losses more intensely than the pleasure of gains.  Remind yourself that bad news is priced into markets far more quickly than you can react.

The fact that bad news travels ten times faster than good news is what separates investors from market returns.

Pessimism just sounds smarter and more plausible than optimism. Tell someone that everything will be great and they’re likely to either shrug you off or offer a skeptical eye. Tell someone they’re in danger and you have their undivided attention.

All of us would be better investors if we just made fewer decisions.

Your portfolio is like a bar of soap – the more you handle it, the less of it you’ll have

Remember your Time Horizon

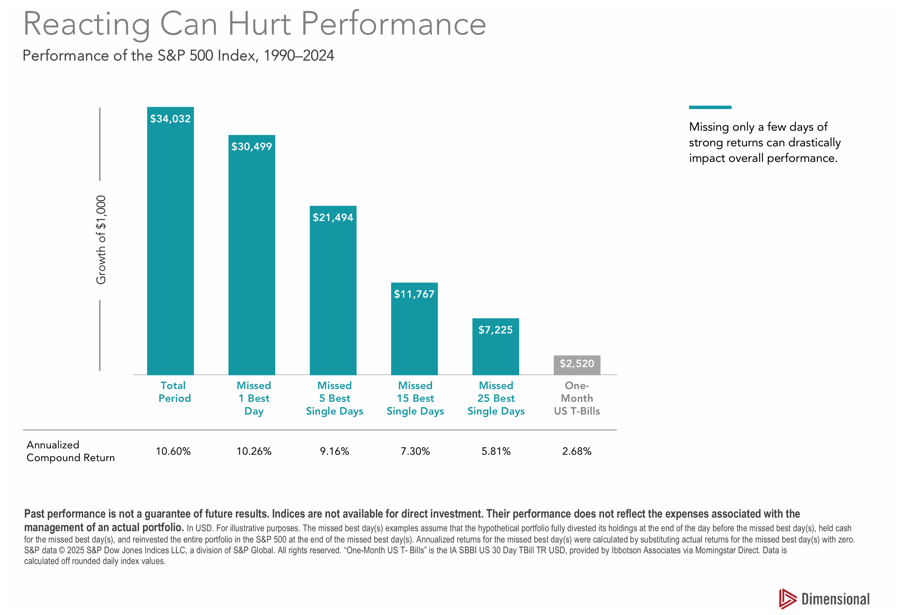
Keep in mind that we’re not risking capital in the markets that can’t stay invested for several years, allowing ample time for price recovery.  We know from experience that, at some point, riskier portfolios will suffer losses of 20%, 30%, 40% or more in a year.  It’s not if, but when.  We also know that, despite these losses, riskier portfolios will deliver higher returns over longer periods of time, which is often the only period that is relevant.

Time in the market beats timing the market.

Everybody in the world is a long-term investor until the market goes down.

We are here to support you in your financial journey in any way we can.  Please reach out if you need any reassurance about your portfolio strategy, maintaining discipline, tuning out the noise, or anything else!

How a Qualified Charitable Distribution Saves You on Taxes

For those of us who are charitably inclined, we will give to our favorite charities because of the good that it does and how it makes us feel. But for many folks, there are often tax strategies available that would help save us money on our tax bills while giving generously. The problem is that many people are not aware of how to best utilize the tax law and apply it to their situation. The Qualified Charitable Distribution (QCD) strategy is one such technique that we help a lot of our retired clients implement.

What is a Qualified Charitable Distribution (QCD)?

Available to taxpayers over the age of 70.5, this piece of the tax code allows IRA holders to make a tax-free distribution from their retirement accounts directly to qualified charities. Normally, IRA accounts consist of pre-tax money that is then taxed when distributed, so the tax-free nature of these distributions is a huge benefit to retirees who are looking to make the best use of their pre-tax savings and benefit their favorite charities.

What are the rules for a QCD?

To be eligible to make a QCD from an IRA account, the account holder must be age 70.5 at the time of the distribution. Notably, the rules do not allow the distribution to qualify as tax-free unless that age threshold has been met – it is not just the year in which someone would turn age 70.5. Additionally, the money must come from an IRA account. For folks with pre-tax money in other types of retirement accounts, such as a 401(k), they’d have to roll over (transfer) the money into an IRA.

When making donations, the money must go directly to a qualified charity. The government doesn’t allow taxpayers to game the system by making donations out to a donor-advised fund, private foundation, etc. and we’d advise making sure that the charity would have a qualified status prior to making the gift.

Eligible taxpayers could make multiple donations to various charities. In aggregate, the IRS allows up to $105,000 of QCDs to be tax-free in 2024 (per person limit). The Secure Act 2.0 stipulates that this limit will index with inflation, so expect that amount to keep going up annually.

Two major pitfalls to look out for!

Pitfall #1:

As mentioned above, the money must go directly to charity to count as a QCD. A common misconception is that someone could take money out of their IRA and then pass it on to a charity. That’s not the case. A distribution to anyone other than a qualified charity will result in the full taxation of that distribution. But if made directly to a charity, the distribution could qualify as tax-free.

For example: if someone took $10,000 from his IRA and then wrote a check from his bank account for $1,000 to a charity, all $10,000 would be taxable income. This person could potentially recoup some tax benefit by putting the $1,000 donation as an itemized deduction, but this is suboptimal – more on that below!

               Working with an advisor like Boardwalk ensures that 1) your donations meet all the criteria to be tax-free and 2) it is done in an easy manner. We set up our clients with a dedicated checkbook to donate directly from their IRA account, manage the cash in the account to meet donations as needed and keep the rest of the balance growing, and keep track of donations for you.

Pitfall #2:

When distributions are made from an IRA account, the custodian (think: Schwab, Fidelity, etc.) will report the total on a 1099-R for that tax year. However, IRA custodians will NOT report whether any/all of the distributions qualified as QCDs. Without keeping track of this, the benefits of making QCDs are lost.

Here’s an example: This year, a 72-year-old taxpayer took $50,000 out of her IRA for spending and gave an additional $10,000 check directly from the custodian to her favorite charity. She’s met all the rules for that $10,000 donation to be excluded from her income BUT the custodian still reports $60,000 of taxable income on her 1099-R for 2024. Unless she specifies on her tax return that $10,000 of her 1099-R taxable income is actually a QCD, she will get taxed on all $60,000. Tax preparers will not know whether distributions were QCD (all or in part) unless told and, even then, they still must report it accurately on the return.

Working with an advisor like Boardwalk ensures that 1) you have someone to communicate with your CPA and 2) your tax return is double-checked for accuracy. No point going through all this hassle only to not get a tax benefit!

Why would a QCD be better than writing a check?

Here’s where the true benefits of a QCD get recognized. Especially if a taxpayer is already itemizing their deductions, the benefit of going through the hoops to make a QCD might not be evident. However, in nearly every case we’ve come across, the QCD strategy should be strongly considered in someone’s giving strategies if they are over age 70.5 and have pre-tax assets. Here’s why.

Itemized deductions might not always be in play, especially after the TCJA raised the standard deduction. Unless a taxpayer already has enough deductions through mortgage interest, property taxes, etc. to eclipse the standard deduction threshold (for age 65+: $16,150 if filing single and $32,300 if filing joint), then there is little or no benefit to itemizing charitable donations. For example: a married couple with $20,000 of mortgage interest and property taxes would be well below the standard deduction. If they gave to charity, the first $12,300 of donations would not provide any tax benefit and only donations above that amount would start to save them on taxes.

Conversely, a QCD is totally excluded from taxable income to begin with. Continuing with the previous example of a couple that had $20,000 of non-charitable itemized deductions: if they decided to give $10,000 to charity via QCDs, they would lower their income by $10,000 AND still get to take the full standard deduction of $32,300. It’s potentially thousands of dollars in tax savings that would otherwise be missed.

There are also a slew of other potential tax benefits from having lower income (not just lower taxable income). Here are some that might apply to you:

1.       QCDs could lower how much of your Social Security income is taxable.

2.       QCDs could allow more of your itemized medical expenses to be deducted.

3.       QCDs lower your income for calculating your Medicare Part B and D premiums. Missing an IRMAA tier by even one dollar results in higher premiums, so even a small donation via QCD could result in thousands of dollars in saved premiums.

4.       QCDs could make you eligible for various income-based tax credits.

5.       QCDs could impact your Net Investment Income tax, saving you 3.8% in taxes on your investment income on top of your marginal tax rate.

A final benefit and potential pitfall: QCDs count towards a Required Minimum Distribution (RMD)

Taxpayers over the age of 70.5 used to be subject to required minimum distributions (RMDs). After the Secure Act was passed in 2020, that age has been pushed back: if you’re not already taking RMDs, then you will be at either 1) age 73 if born before 12/31/1959 or 2) age 75 if born in or after 1960. RMDs are calculated from someone’s pre-tax savings and age. The amount that must be taken varies, but one thing is certain: it’s taxable income!

A qualified charitable distribution (QCD) can count towards someone’s RMD. This is great news because it allows for some tax planning for clients that are charitably inclined. So for someone with a $50,000 RMD in 2024: if $10,000 was given as a QCD and then the remaining $40,000 was distributed to that person’s bank account, that person would only have $40,000 of taxable income despite having satisfied the government’s requirement to take $50,000 of pre-tax money out of his or her IRA account.

The pitfall? The QCD must occur prior to the balance of the RMD being distributed. If someone takes their RMD first, they won’t have the opportunity to lower their taxable income. However, the QCD is still excluded from income and so it remains one of the best ways to give to charity even if someone needs to take his or her full RMD for living expenses.

               Working with an advisor at Boardwalk means that we carefully review your tax situation each year and consider how your tax situation will change in the future. Our recommendations don’t stop at utilizing QCDs – if we identify an opportunity to slide under an IRMAA tier, drop a tax bracket, or lower the taxability of Social Security by increasing your QCDs by a specific amount or pulling forward your donations from a future tax year into the current one, we’ll show you how it could save you a lot in taxes. (And follow through to make sure your CPA reflects it properly on your tax return!)

Please don’t hesitate to reach out to us with any questions on how to save money through your generous donations. 

The Magnificent 7 Ruled the Markets Last Quarter, Should This Change How You Invest?

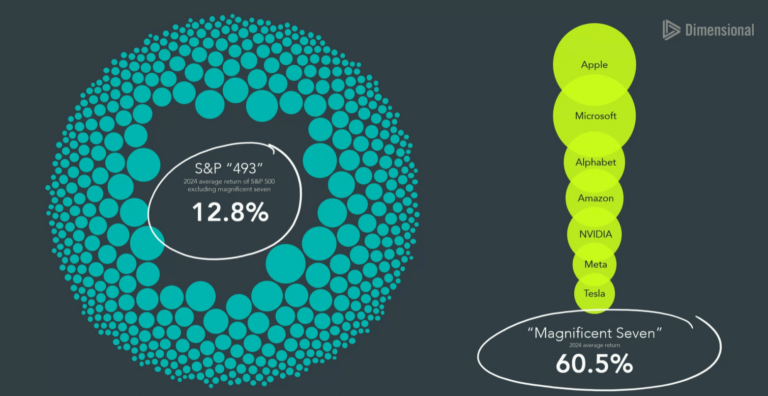
A familiar theme continued during the second quarter of 2024: US stocks led all other major asset classes, with most of this performance attributable to just a handful of technology companies. Last quarter’s commentary discussed why it continues to make sense to be diversified across global equities. This quarter, we’ll take some time to look at why US large cap stocks have performed so well recently and why, even against that backdrop, it still makes sense to diversify amongst US stocks.

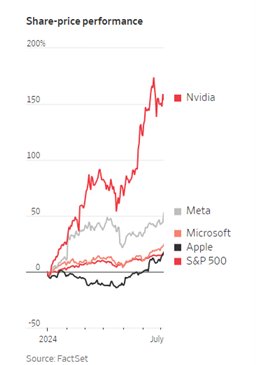
This year, Nvidia hit both the $2 trillion market capitalization (share price x shares outstanding) milestone and then in June, four months later, it eclipsed the $3 trillion mark. For a brief moment, it was the most valuable company in the world. This title has consistently been held by either Apple or Microsoft over the past decade. All three companies were worth over $3 trillion at the end of the second quarter. These companies, along with a few others, have contributed most of the US equity market’s return this year.

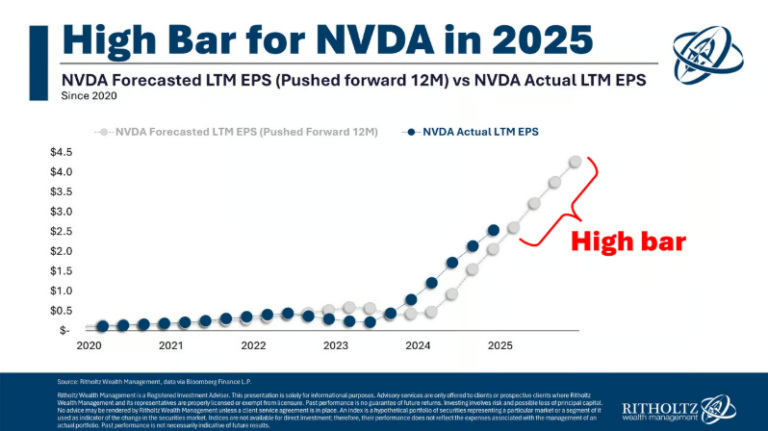
Nvidia rose 37% in the last quarter and has tripled in value over the last 12 months. As a result, it has contributed 1/3 of the S&P 500’s year-to-date return. Microsoft, Amazon, Meta, Alphabet, Tesla, and Apple – the other “Magnificent Seven” members – and Nvidia are responsible for about 60% of the S&P 500’s rise this year. This is abnormal, but there is reasoning behind it. Over the last year, Nvidia, Amazon, Meta, Alphabet, and Microsoft grew their earnings (profits) by 84%, whereas the rest of the market increased earnings by about 5% relative to the year prior. More importantly, these companies all exceeded the market’s expectations for earnings and earnings growth.

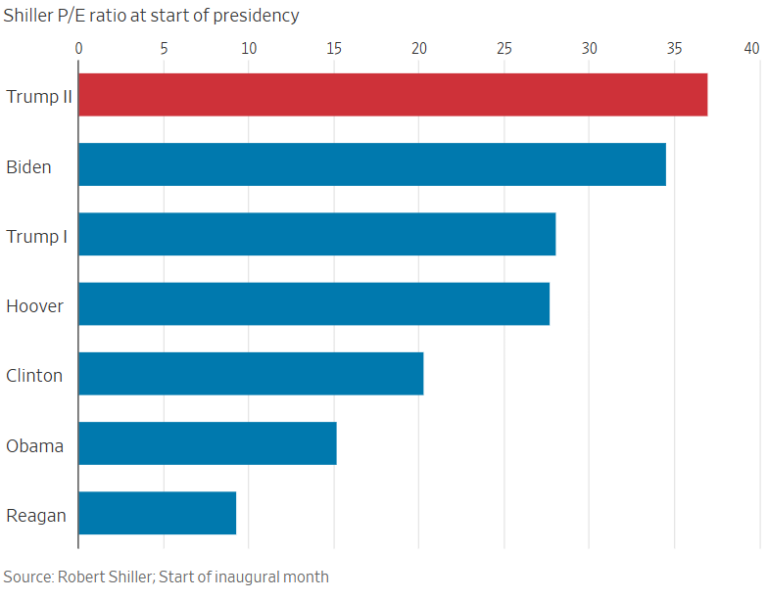
Analysts will often reference a P/E ratio (“price to earnings” ratio) to illustrate how expensive a stock is relative to that company’s profits. According to FactSet data, the Magnificent Seven stocks are trading at 37 times their expected earnings over the next 12 months whereas the S&P 500 trades at 21 times forward earnings. While recent fundamentals have supported stronger stock valuations for those companies (they have handily beat earnings expectations over the last year) time will tell whether they will continue to top lofty expectations.

Not only do those companies have massive revenue and profit streams, but they are also investing heavily in generative AI technologies and applications. You’d be right to think of it as an arms race! To get an idea of how much money is being poured into AI, consider this: the five companies I just listed recently accounted for 22% of all US research and development capital expenditures. Over the coming quarters, investors will pay close attention to how much revenue and profits those enormous investments will generate.

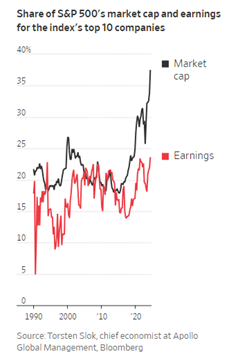
A major risk to investors in the US stock market is that as the largest US companies increase in value, lifting the S&P 500 higher, the index continues to become more concentrated. Right now, investors are so optimistic about the largest US companies that they are willing to pay outsized prices for shares of those companies (as indicated by the P/E ratios I referenced earlier). At the end of the third quarter, Apollo Global Management notes that the top 10 stocks in the S&P 500 make up 37% of the index while contributing 24% of its earnings. That’s the largest gap since 1990. 

Torsten Slok, Apollo’s chief economist puts it well by saying: “The problem for the S&P 500 today is not only the high concentration but also the record-high bullishness on future earnings from a small group of companies.”

If those heavyweights fail to deliver on growth and profit expectations, there will almost certainly be a stock market correction.

To “beat the index? when the largest names are only getting bigger, would require an investor to own even more than the representative portion of those stocks.

Of course, an outsized position in Nvidia doesn’t sound like a bad thing looking backward! But being less diversified only works if the right bets – at the right time – are chosen AND then properly exited before the tables turn. For long-term investors, being diversified amongst all areas of the market will produce better outcomes. It’s been a great year to be an investor in US equities – there’s no sense complaining about how it could have been better with an even more concentrated gamble on the largest tech stocks.

As we all know, diversification means that portfolios will hold both the best-performing assets and the laggards. Over time, combining assets with high expected returns but different paths toward those returns (i.e. non-perfect correlations) provides investors with a better risk-adjusted return. Said another way, diversified portfolios don’t swing as wildly – which provides investors with greater peace of mind and, for retirees, could prompt them to be more confident in their spending levels.

At Boardwalk, we have our clients’ long-term goals in mind and we work to help our clients be comfortable and confident in their financial future. 

An Exploration into Restricted Stock Units

The world of employee benefits and compensation is constantly expanding, making it ever more important that you fully understand what your employer is truly offering you. One VERY attractive way to compensate employees is in the form of Restricted Stock Units (RSUs). Below we’ll discuss the high-level facts you should know about this type of compensation.

What: A restricted stock unit (RSU) is an award of a company’s stock share that comes with certain requirements the recipient must meet before the stock is transferred to your ownership. This is a great benefit to have as it means more money coming to you, it’s just in the form of company stock. If the company does well, the value of your shares will increase as the stock price increases. Of course, the opposite could also hold true.

Why: RSUs are a way for your employer to offer higher compensation without affecting the business cash flow. You benefit by receiving additional income and participating in the company’s success. An advantage of RSUs versus other types of equity compensation is that there is no expiration date, and you will receive some value for these shares down the road (although it could be more or less than originally stated). Employers use RSUs to reward long-term employees and help align employee interests with the company’s performance. This is a common perk used to attract top talent in job offers.

*** Tip: If you are negotiating a new contract/job offer, you can likely negotiate for more RSU shares if they will not go higher on salary, allowing you to receive higher compensation.

 Vesting: RSUs come with a vesting schedule (aka distribution schedule) that details the time frame and required performance milestones you must meet to own the shares. The vesting schedule can encourage long-term employment as most employees do not want to leave a company with shares left behind.  

Taxes: RSUs are taxed as ordinary wages upon the vesting date. The mandatory withholding is 22% but be careful as your actual tax bracket may be higher than that causing you to potentially owe additional taxes on that income. You can hold the shares after vesting if desired. In that case, any future gains or losses will be subject to capital gains tax treatment. Keep in mind that if you hold the shares after vesting, you will still owe ordinary income tax on the original vested shares, and you’ll need to come up with the cash to pay your tax bill elsewhere.

***Tip: We highly suggest discussing your vesting schedule with your CPA to ensure you pay an adequate amount to taxes each year and avoid underpayment penalties.

Diversification: Holding a concentrated position of any company’s stock increases risk. While you may start off with a small portion of your shares vesting, eventually you may own a large amount of your employer’s stock as more shares vest. Diversifying your portfolio by selling some shares may become prudent to remain aligned with your targeted investment allocation (and necessary to fund some of your goals!).

***Tip: Most companies have blackout windows where key employees cannot sell their shares so be sure to watch for those.

RSUs for a Private Company

Double-Trigger/Single-Trigger Vesting: For private companies, vesting requirements may include what’s known as a double-trigger for vesting. This type of vesting states that the company must go through a liquidity or succession event to own the share. It is known as single-trigger vesting if you can own the share after the time/performance period alone, even if the company has not gone public.

Valuation: Unlike public companies with readily available stock prices, valuing RSUs in a private company is harder to determine. If a company has a single-trigger vesting, a 409A valuation is done by an independent appraiser to provide the value for the shares.

Exit Strategy: It’s important to note what options you have to sell your vested shares, and the company’s planned timeline(s). Is the company planning to IPO? Are there other exit opportunities/succession plans on the horizon? If double-trigger vesting is in play but the company does not IPO, your shares could never come to fruition. If a single-trigger vesting is in play, you will need to know the possibilities of selling these shares back on the private market.

Diversification: After IPO, it is important to note that there is typically a 180-day market blackout where no shares can vest or be sold.

In conclusion,RSUs can offer rewarding (and confusing!) compensation opportunities for employees. Boardwalk Financial Strategies’ advisors are well equipped to answer your RSU and other equity compensation questions. At Boardwalk, we include your equity compensation in your financial plan integrating your RSUs with your tax planning, cash flow, diversification of your portfolio, and more.


What Should the Financial Media Focus On?

I have a pet peeve with financial media and news reports on the stock market in general.  Well, I actually have a lot of pet peeves about the financial media, but this commentary will discuss why one in particular can create issues with expectations vs. reality.  

When is the last time you heard a TV news anchor recite the day’s market movement of the MSCI EAFE or the Russell 2000 Value indices?  The US financial media generally only reports the returns of three measures of the stock market: the S&P 500, the Nasdaq, and the Dow Jones Industrial Average (“the Dow”).  Unfortunately, all of these are slightly different measures of the performance of US large company stocks—only one segment of the diversified portfolio owned by most investors.  For a Boardwalk 60% stock, 40% bond portfolio (“60/40”), the information provided by the financial media tells you about the returns of only 11.5% of the portfolio (and 19% of the equity portion of the portfolio).

Why do we only have 19% of the equity allocation in US large company stocks?  Perhaps a quick sidebar on diversification would be helpful before we proceed.  Investors and advisors divide up investment markets in many different ways: stocks vs. bonds, large vs. small company stocks, “growth” stocks vs. “value” stocks, and developed vs. emerging economy stocks.  Beyond stocks and bonds, there are also Real Estate Investment Trusts (REITs), commodities, private equity, and other categories.  The reason we categorize these segments of the market—called “asset classes”—differently is because they tend to have different risk and return characteristics and are not highly correlated with each other.  If different asset classes have attractive long-term expected returns but “zig and zag” differently, blending them together can provide a smoother “ride” for the portfolio while still producing a solid long-term return.

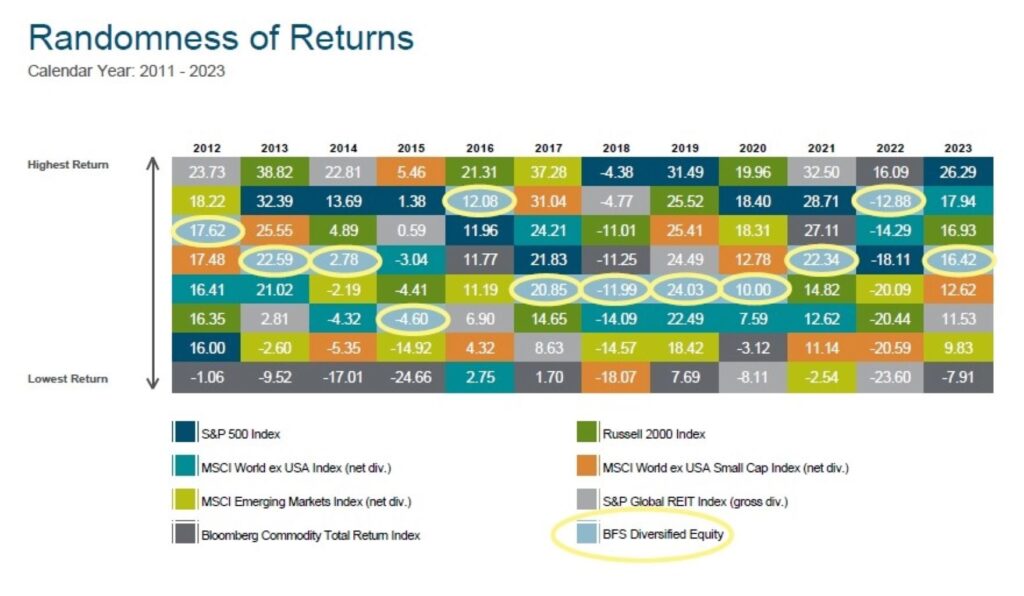
The chart below is a great reminder of why we diversify.  It shows the major equity asset classes, each with their own color, and ranks them vertically in each year’s column from best annual return down to worst.  The light blue box with red outline is the blended return of a diversified equity-only portfolio that includes all the asset classes shown in the chart.  It would be nearly impossible to predict which asset classes would be near the top of the column each year, but you can see that the diversified equity portfolio provides a better-than-average return without requiring any predictions.  It’s never the worst performing, but it will never be the best performing either (that’s mathematically impossible). 

Now back to those media reports. The returns on the S&P 500, the Nasdaq, and the Dow have been remarkable over the last 10 years. So remarkable, in fact, that other segments of global equity markets have not been able to keep up. The chart below shows the annualized returns of various asset classes over the 10 years ended March 31, 2024.

Typically, the best performing asset class rotates more frequently, but when the outperformance of any one asset class is as large and as persistent as the current run for US large company stocks, the diversified portfolio return can lag the top performer significantly.  To further pile on: when the outlier asset class is also the most visible (i.e. US large company stocks thanks to the attention provided to them), the urge to “do something about it” can be strong. 

Would “doing something” mean loading up on stocks of large US companies? Would it mean loading up on stocks in the “Magnificent Seven” such as Nvidia that have been on a historic run?  If that seems risky, you’re right, it is.

After an asset class dominates performance for a long period of time, it tends to either become overvalued or the other asset classes look very attractively valued relative to the recent top performer.  Looking at the last notable period where US large company stocks enjoyed significant outperformance, the returns tend to underperform in the following period. The best recent example of this was the late 1990s when internet and technology stocks were unbeatable during the “dot-com” era.  By 2003, the fortunes of those stocks had reversed quickly.  Below are the returns of various asset classes for the five years ended 12/31/1999 and those of the subsequent 10 years.  While this doesn’t mean the fortunes of these asset classes must immediately reverse, it is certainly more likely than five years ago.

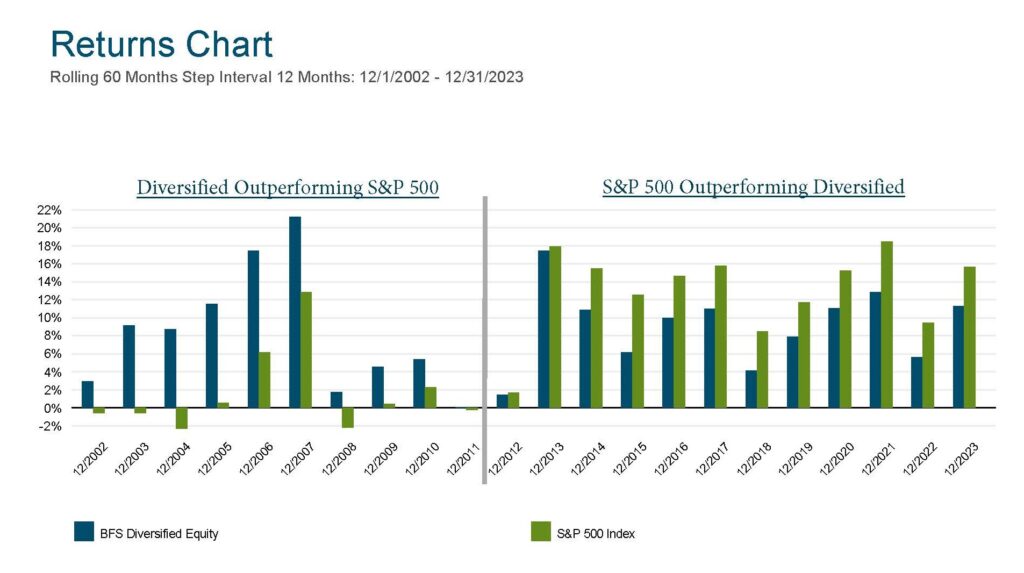
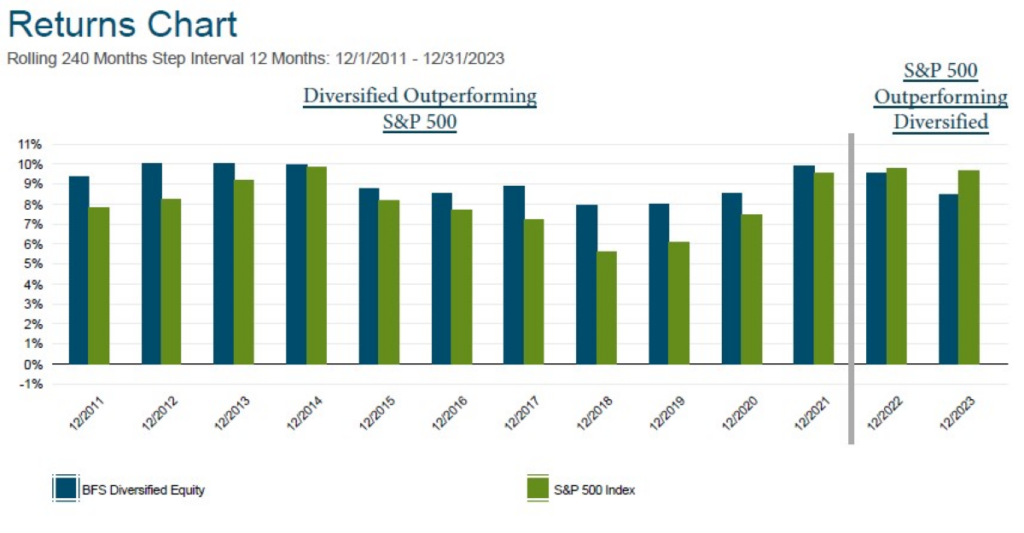
Rolling period returns can be helpful in zooming out and viewing longer periods of time in single data points.  In the series of below charts starting with 5-year rolling returns, then 10-year, and finally 20-year rolling returns, you can see how acute the S&P 500 outperformance can be over 5-year periods, but as you lengthen the time period to 20 years, it’s only the two most recent 20 year observation where the S&P 500slightly outperforms the diversified portfolio (and only after the staggering 10-year outperformance of other asset classes seen in the chart above. 

5-Year Rolling Chart

10-Year Rolling Chart

20-Year Rolling Chart

Should investors have been able to predict this strong period of US large company outperformance or recognize the trend early and add exposure?  So called “tactical asset allocation funds” have the flexibility to adjust their mix of asset classes based on their forecasts.  If there was a clear signal that one should have bet heavily on US stocks, those funds would have done it.  They didn’t.  Instead, they have failed miserably relative to a fixed (non-tactical) asset allocation, as pointed out by Morningstar in articles over the last few years (here and here).

We believe that the equity portion of our clients’ diversified portfolios will be competitive with the S&P 500 over their investment time horizons, but there will most certainly be periods of time when a specific asset class leads the pack and outperforms a diversified equity portfolio over a multi-year period. This does not mean that diversification is broken.  In those moments, it may be helpful to keep in mind one of my favorite maxims regarding portfolio management: “A portfolio is like a bar of soap.  The more you handle it, the less of it you have.”

Do I Need a Life Insurance Trust?

Do I need a Life Insurance Trust?

For higher-net worth individuals and families, life insurance and estate planning are important to consider together. To explain why, let’s revisit another personal finance topic: taxes! Life insurance is usually income tax free. However, life insurance is counted as part of a decedent’s estate and estate taxes are assessed on a decedent’s personal wealth (estate) at the federal level and in many states. Thus, life insurance is potentially subject to estate taxes, assuming someone’s estate exceeds the exemption amounts – unless advance planning is done. An irrevocable life insurance trust (ILIT) is a tool to help protect life insurance proceeds from estate taxes. At the end of this article is an example of how our recent work with an Illinois client could save over $1.0 million in estate taxes.

How does an ILIT work?

As the name would suggest, an attorney creates a trust for someone that holds the life insurance policies. The ILIT can either purchase new policies or receive existing ones (by sale or gift). Both the owner and beneficiary of the policies is the trust, though the insured person remains the same.

The insured person is the grantor of the trust and funds the annual premiums with gifts made to the ILIT. As long as gifted premiums do not exceed the annual exclusion gift amount ($18,000 per beneficiary in 2024), no gift tax return needs to be filed. Because life insurance proceeds are income tax free, the trust doesn’t pay income taxes when it receives the death benefit . And because of the irrevocable nature of the trust, the policy and death benefit proceeds are also excluded from the grantor’s estate. Very complex tax and legal concepts were just summarized in four sentences, but this is an established method of getting life insurance proceeds “outside” of someone’s estate and we’ve utilized it for many clients.

What are the pitfalls?

Aside from added complexity and cost, you should be aware of these two pitfalls when considering this planning technique to reduce or eliminate potential estate taxes.

First, while it is best practice to purchase life insurance directly through the ILIT, it’s often the case that an ILIT is implemented years after someone initially bought some life insurance policies. Whether there’s been a health change or not, it usually makes sense to keep older policies since premiums increase with an insured’s age. Two options are available to get the policies “into” the ILIT: a gift or a sale.

    • A gift is much easier to process, but the insured needs to survive a three-year lookback period – otherwise the IRS deems the death benefit to be included in the decedent’s estate. This is in place to avoid abuse via last-minute ILIT strategies.

    • A sale by the owner/insured to the ILIT is a much more complicated process, but there isn’t a survivorship requirement.

Second, everything must be set up properly for the ILIT to pay premiums, including an annual notice to the trust’s beneficiaries. This notice is called a “Crummey Notice” after the strategy’s creator successfully defended its legality in the 1960’s.

    • Each part of the annual gift, notice, and payment process must be followed to a T and properly documented for the IRS to honor the exclusion of life insurance proceeds from the insured’s estate.

There’s upfront leg work to implement this strategy and annual “maintenance” to successfully keep the life insurance proceeds outside of someone’s estate. To determine whether it’s worth that hassle, we consider our clients’ current wealth, potential life insurance proceeds, and their financial trajectory to see if it’s important to plan around estate taxes.

How much money does someone need for estate taxes to apply?

There are exemption amounts at both the federal and state level before estate taxes apply. In 2024, someone could pass away with $13.61 million without any federal estate taxes (this amount doubles for a married couple). But wealth over that amount is subject to a top tax rate of 40%! Per the 2017 Tax Cuts and Jobs Act (TCJA), the exemption amount is slated to cut in half starting January 1, 2026.

Most states don’t have any estate tax (including Wisconsin). For those that do, both the exemption amount and tax rate vary. Illinois has a $4,000,000 exemption per individual and a top rate of 16% that would apply to wealth above that amount.

Proper estate planning can easily save 6- or 7-figure amounts for high-net worth families. Instead of going to taxes, that wealth passes to the next generation or other beneficiaries.

What’s an example of an ILIT helping reduce taxes?

As previously stated, life insurance is income tax free but increases the beneficiary’s estate, so there could be estate tax repercussions. Let’s look at an example that’s similar to an Illinois client we recently helped…

Using round numbers, the husband and wife currently have $6,000,000. This is split amongst their retirement accounts, cash, home, etc. – $4.0 million in the husband’s name and $2.0 million in the wife’s name. They both have strong incomes and bright careers ahead of them, so they both have life insurance policies to support the surviving spouse & their three kids, pay for college, pay off the mortgage, sustain the family’s lifestyle, and have funds set aside for retirement. The husband has $3,000,000 in life insurance and the wife is insured for $2,000,000.

  Husband Wife
Current Wealth $4,000,000 $2,000,000
Life Insurance $3,000,000 $2,000,000
Gross Estate (no ILIT) $7,000,000 $4,000,000

If the husband passed away, his estate would have $7.0 million. That’s a far cry from the current federal estate tax exemption amount of $13.61 million (though it would be very close to the post-TJCA exemption of ~$7M that will kick into effect in 2026). However, it is above Illinois’ flat $4.0 million exemption (which doesn’t adjust with inflation). An Illinois tax bill on the excess $3,000,000 would be $565k, but this tax bill is kicked down the road by utilizing a martial deduction.

The wife would now have $7.0 million PLUS her own $4.0 million if she passed away shortly after ($11.0 million in total). The problem with this though, is now there is an (even bigger) $1.058 million Illinois tax bill upon the wife’s passing since Illinois doesn’t recognize portability. Confused? You’re not alone! We suggest getting professionals involved in situations like these.

An ILIT would help to mitigate the risk of estate taxes, so we helped transfer just the husband’s policies into an ILIT and now the situation would play out as follows. The $3.0 million of insurance money ends up “outside” his estate.

  Husband Wife
Current Wealth $4,000,000 $2,000,000
Life Insurance (in ILIT) $3,000,000 (excluded) $2,000,000
Gross Estate $4,000,000 $4,000,000

A good estate plan would utilize the full $4.0 million Illinois exemption upon the husband’s passing (as explained above) and then again on the wife’s passing.

Combined with an Irrevocable Life Insurance Trust (ILIT), no federal or Illinois estate taxes are owed, and the full $11.0 million of wealth & insurance proceeds all go to the couple’s beneficiaries.

The ILIT component would save Illinois estate taxes of $565k (on $3.0 million) and the combined effect of good planning would save over $1.0 million! 

We love helping our clients save both income and potential estate taxes through great financial planning.

Of course, this situation doesn’t apply to all high-net worth clients. But even for folks that seem far away from crossing over federal or estate tax exemption amounts, a robust financial trajectory and/or life insurance proceeds may surprise them down the road. As their wealth continues to grow, the value of their estates will become much larger than currently anticipated. We take a proactive approach to insurance and estate planning to help minimize taxes and transfer as much of our clients’ hard-earned savings to their beneficiaries.

Should Expert Predictions and the Financial Media Guide Your Investment Decisions?

Summary

As great of a year 2023 was for investors, it’s even more notable how much better than expected the year turned out. We dig a little deeper into how the past few years have fared compared to expert predictions.
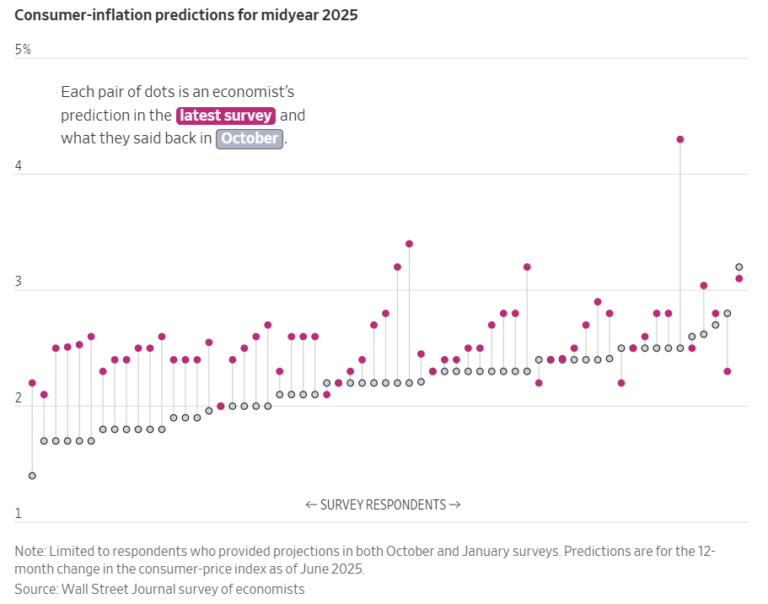
The commentary below proves expert predictions are probably better described as guesses. Basing your investment strategy on what the media says could get you into trouble.


2023 was an amazing year for investors, even though no one expected it! Rewinding to one year ago, investors were still in the doldrums after a horrible 2022 that saw both stocks and bonds decline by double digits. On the docket for 2023 was a year full of interest rate hikes, inflation pressures, wars, and – so we all thought – a recession. As a result, many investors were content to accept a (finally!) decent return on cash and just wait out the year. The Wall Street Journal summed it up well: “Almost no one thought 2023 would be a blockbuster year for stocks. They could hardly have been more wrong.”

Despite what the investment strategists, economists, and media pundits may say, it will be very difficult to correctly predict how the economy and your investments will perform in 2024. Even if someone predicts accurately in one area – say, geopolitical risks or corporate profits or consumer strength – how the market reacts and moves during a year is so complicated that few, if any, can be right enough to make a profit off it on a consistent basis. Because not only does someone have to address data outcomes or event-specific risks, but that investor would also need to predict how human behavior reacts to that myriad of interwoven factors.

The last four years are a great string of examples for this.

2020:

  • What was predicted: Well, we’ll give everyone a “pass” for 2020.
  • What happened: A global pandemic, of course. In investing we call these “black swan” events – world-changing events that no one predicts but inevitably surface occasionally.
  • How markets performed: Despite a historic crash in the spring of 2020, everything did quite well to end the year. The S&P500 return was 18.4% for the calendar year.
  • Verdict: No one predicted the violent crash nor the rapid recovery in 2020.

2021:

  • What was predicted: A continued economic recovery, but still pretty average market returns. On the high end, some predicted double-digit returns but there were just as many experts forecasting a flat stock market.
  • What happened: Despite persistent effects from the virus, the US economy surged back to life as consumers just shifted where they spent money and companies adapted. Inflation was the “consequence” from combining a robust, stimulus-fueled recovery with supply chain issues, but during 2021 it still hadn’t hit full swing yet.
  • How markets performed: The S&P 500 hit 70 new all-time highs on its way to a monster 28.7% gain.
  • Verdict: At this point the pandemic still wasn’t behind us. So, it’s understandable how few anticipated the “V-shaped” economic recovery, and none nailed just how stellar market returns would be.

2022:

  • What was predicted: Maybe it was the rose-colored glasses of 2021 since, despite high valuations and a telegraphed set of Federal Reserve rate hikes to combat inflation, forecasters said markets would be up.
  • What happened: Interest rates surged at the fastest pace in decades and US inflation peaked at 9.1% in June. The economy still managed to grow about 2%, but there was widespread pessimism.
  • How markets performed: The S&P 500 posted its worst year since 2008 (-18.1%) and bonds had their worst year ever (the Bloomberg Barclays Aggregate Index fell over 13%). Areas with the highest valuations and best 2021 returns fell the most in 2022: technology companies, “meme stocks,” cryptocurrencies, etc.
  • Verdict: Another miss!

2023:

  • What was predicted: 85% of economists in a Financial Times poll expected a US recession in 2023 and the IMF said that a third of the global economy would be in recession along with the United States. And it wasn’t just economists and rap artist CardiB…we all figured it would happen in 2023.
  • What happened: Not only did the US avoid a recession, but the global economy managed better than expected on average. Few would have also predicted a banking crisis, a government debt showdown, or Artificial Intelligence mania to fill the year.
  • How markets performed: It was a banner year for stocks (S&P 500 up 26.3%), and everything did well in the 4th quarter rally.
  • Verdict: No doom and gloom. And even for the optimists, investment returns exceeded all forecasts.

It’s clear that relying on future forecasts would have been a dangerous investment strategy over the last four years. Fear and greed, the opposing sides that encompass much of human investing behavior, influenced investors to be overly cautious heading out of the covid crash and 2022 declines but also overly confident after 2021’s rally. Just imagine the difference in portfolio return had you heeded the collective advice of the prognosticators vs. sticking with a disciplined investment strategy!

Poor predictions aren’t just a post-covid phenomenon (2020 onward). A piece by the New York Times looked at a 24-year time period: 2000 through 2023. Rather than just giving a “verdict” as I did above, they measured the difference between the median forecast and actual returns of the S&P 500. For example, in 2022 a median forecasted rise of 3.9% was wrong by a margin of ~24% given the S&P 500’s 18% fall. So, how far “off” is Wall Street each year?

“…the median Wall Street forecast from 2000 through 2023 missed its target by an average 13.8 percentage points annually…”

Talk about a wide margin of error! If your advisor, YouTuber, or CNBC host is touting their market prediction abilities, the evidence is clear: they just got lucky and that will be very, very difficult to repeat consistently. Despite ever increasing and timely data, market transparency, and better understanding of investor behavior, reliably forecasting the stock market remains elusive. In that light, a humble and disciplined approach to investing is best.

At Boardwalk, we help clients pick a portfolio that’s right for them and that they can stick with during rough times – this strategic approach is the proven winner in investing over the long run. Tactical investing (zigging and zagging amongst assets) results in poor investment outcomes on average. Instead of trying to identify how the market is wrong, we seek to harness the enduring relationship between risk and return by emphasizing the risks the market has rewarded consistently and persistently for long-term investors. Then, we go the extra mile to make sure that the things we can control – like tax efficiency, rebalancing, or getting excess cash to work –remain the focus to enhance wealth creation over time.

Our clients share that they enjoy peace of mind knowing their low-cost, diversified portfolio is designed to meet their long-term goals and promote financial security. Without knowing what’s in store for 2024, we hope these truths can provide you with confidence for the years ahead, no matter what they bring.

Get the Most Out of Your Employee Benefits

For many, employee benefit elections for 2024 are just around the corner, and it’s important to know what you’re getting into before making any decisions. There will also be higher 2024 maximum contribution limits for workplace retirement plans. To take advantage of that, it may require you to change your contribution rate(s). We are here to help you navigate these decisions with confidence and peace of mind.

Many employers are focused on cost management in this economic environment. Since health benefit costs are expected to jump 5.4% this year, you may see a change towards a high deductible health care plan. This could mean higher out-of-pocket costs despite a lower monthly premium, so let us help you understand the difference compared to regular health insurance. As Brittany wrote about last month, enrolling in a high deductible plan could give you access to a Health Savings Account (HSA) – a fantastic long-term, tax-advantaged growth vehicle.

    • The HSA annual contribution limit in 2024 for self-only coverage is rising to $4,150 from $3,850 in 2023. The cap for family plans is jumping to $8,300 from $7,750. The catch-up contribution remains at $1,000 per spouse aged 50+.

There are typically other benefits offered by employers too, including voluntary life insurance benefits. This gives you the option to get additional life insurance without any health underwriting. However, it’s usually more costly than traditional term insurance. We don’t sell insurance but will help you navigate the options. We’ve helped some clients optimize their workplace and private policy mix, saving thousands of dollars in annual premiums. It is one example of many where we’re able to help optimize the additional benefits you’re offered.

Finally, 401(k) and 403(b) contribution maximums for 2024 will be announced next month and it’s widely expected that the maximum will increase to $23,000 from $22,500. Like HSA accounts, retirement plans allow catch-up contributions for those aged 50+. As we wrote about in January, the SECURE Act 2.0 required “high wage earners” – defined as those making $145,000 or more – to only make catch-up contributions with post-tax dollars.

    • Last month, the IRS announced a two-year delay to enable employers more time to add Roth 401(k) features to their plan. So, starting in 2026, high wage earners will need to contribute their $7,500 catch-up to their Roth 401(k).  Your employer plan should handle this for you automatically.

We will advise you to make pre-tax, after-tax, or Roth contributions based on what makes sense for your tax situation. If your compensation has changed, it may also make sense to adjust your contribution rate.

Employee benefit elections for 2024 can be a complex process that requires careful consideration of many different factors. We can help you understand what’s available and guide you towards the best decision for your family.

HSA? More Like HS-YAY!

Picture of Brittany Falkner

Brittany Falkner

Wealth Manager

Health Savings Accounts, otherwise known as HSAs or (HS “yay”s if you are a tax nerd like me) are one of the most underutilized account types that I have seen in practice. While these accounts are only available to individuals with high-deductible health plans, I often see clients completely missing the benefits that these accounts can provide. Below, we’ll go over why you should love these accounts and some best practices to make the most of these tax-advantaged accounts.

What is an HSA?

Health Savings Accounts let you set aside money on a pre-tax basis with all withdrawals being tax-free when used for qualified medical expenses .1 This means you can direct a portion of your wages toward this account and never pay tax on these dollars (assuming all withdrawals are for qualified medical expenses). When invested, the growth within the account is also tax-free! There are no other savings vehicles that have such glorious tax benefits, which makes HSAs known as triple tax-advantaged (money goes in tax free, grows tax free, and can come out tax free). To put the cherry on top, these accounts have no income limits, so high income earners are eligible to contribute (many other savings options have income limits, such as an IRA contribution).

You are eligible to contribute to a health savings account if you are enrolled in a high deductible health plan. For 2023, you have a high deductible health plan (HDHP) if your deductible is at least $1,500 single ($3,000 family) and your maximum out-of-pocket is no more than $7,500 single ($15,000 family). If that is true, you are eligible to contribute $3,850 if insured under single coverage ($7,750 family) to an HSA account. If you are over the age of 55, you may contribute an additional $1,000 per year. As a friendly reminder, unfortunately you are not eligible to contribute to an HSA once you are on Medicare.

Be sure to tell your tax preparer about any contribution you make and keep all medical receipts in your records. You may use this account to pay for qualified medical expenses for yourself, your spouse, and any dependent you claim on your tax return.

Best Practices & Hot Tips for HSAs  

The secret sauce to fully utilizing this tax haven of an account would be to contribute the maximum you can each year, invest the dollars, and to let the account grow until retirement or later. Most retirees are hit with the largest healthcare expenses later in life and that is when this account can really come in handy. By delaying the use of these funds, you are also maximizing the amount of tax-free investment growth! If you have been thinking of this account as a medical checking account you aren’t wrong, but I would encourage you to view this account as a retirement savings vehicle that has great tax advantages.  

Another hot tip to consider is that there is no time limit for reimbursing yourself for medical expenses. This means if you save your medical receipts throughout the years, you can reimburse yourself from your HSA account at any future point for past expenses, tax-free. To do so, you will need to keep meticulous records, ensure you were enrolled in a HDHP in the year the expense occurred, and ensure you did not claim a medical deduction for that expense on your tax return. If you are concerned about passing away with this pot of money, the good news is that HSA accounts allow for beneficiary designations. If you pass this account to your spouse after your death, your spouse will receive the same tax benefits, tax-free growth and withdrawals when used for medical.

To ensure you are maximizing this account, you will want to pay close attention to the HSA contribution limits each year. The contribution limits increase with inflation each year with the most recent increase being an astonishing 7% for 2024. For 2024, the contribution limits increase to $4,150 single ($8,300 family). Further, once you and your spouse are both over the age of 55, you are each eligible to contribute the additional $1,000 contribution. To keep the IRS happy, each spouse would need their own HSA account and the additional $1,000 would need to be deposited into their respective accounts. This provides a fantastic opportunity to super fund these accounts for those nearing retirement.

Lastly, you are eligible to contribute to an HSA account until April 15th of the following year for the current year, assuming you had a HDHP for the entirety of the previous year. This could come in handy if you forgot to max out the account, if you need additional tax savings on your return, or for additional tax planning purposes.

Final Thoughts

At Boardwalk Financial Strategies, we are a team of advisors with extensive tax backgrounds. This allows us to build comprehensive financial plans for our clients utilizing the above tax saving strategy and more. If you would like to learn more about our comprehensive wealth management services, please contact us today.

1 To see the full list of qualified medical expenses, please see the IRS Publication 502.


Three Tips for Your Home, Auto, and Umbrella Insurance

When was the last time you reviewed your auto, home, and umbrella insurance policies? If you haven’t done so recently, it might be prudent to revisit your coverages. For example: when it comes to homeowner’s insurance, you’ll want to make sure that your replacement cost is updated to reflect today’s higher housing prices and construction costs (and all those pandemic updates you made on your home)! Let’s dive a bit more into what replacement coverage means for you and two other quick tips.

Replacement cost coverage:

If your home needs to be partially or fully repaired or rebuilt due to a covered event, the insurance company will pay up to the replacement cost within the policy. It doesn’t matter if the shingles are 10 years old or the porch is brand new, insurance companies will replace your home or home components without considering depreciation. So, it matters what your home would currently cost to rebuild – recently we’ve seen many policies have inadequate coverage because housing costs have risen. We recommend you revisit this with your insurance broker or agent.

When you do, we recommend that you pay attention to how the policy defines replacement. Standard replacement cost replaces your home with fixtures, materials, and function as close as possible to what it’s like now. Functional replacement cost will build you a new home, but it may not be the same value – you’ll save on premiums, but the insurer will only replace your damaged property with something that functions the same way. Guaranteed replacement cost is a step up from the standard: just in case your home actually ends up costing more to rebuild than the policy states, your insurance company will foot the bill. There’s more to these differences, of course, so we suggest you discuss the coverage details with your agent.

Personal property coverage:

Everything from the clothes in your closet to the artwork on the wall and the new couch you just bought falls under the category of personal property within your homeowner’s insurance policy. You’ll want to make sure you have a conservative coverage amount relative to what you think everything is worth (prices aren’t exactly the same as they were even a few years ago). Your insurance company usually caps how much they’ll pay for certain items, like jewelry or valuable artwork, so you may need to list those as personal articles.

If you ever needed to file a claim, here’s one way to know what you owned: each year we suggest that you walk through your home, videoing. Pan over rooms, open drawers, and add commentary as necessary. This will make your side of the claims process way easier than trying to remember things after a very stressful loss. It’s also much faster than categorizing everything you own now on a written list.

Uninsured (and underinsured) motorist coverage:

If you’re in a car accident, this endorsement (extra add-on) will kick in to pay for your bodily injury expenses or vehicle damages if the other driver didn’t have insurance (or had inadequate insurance). Wisconsin requires uninsured motorist coverage (at least $25,000 per person and $50,000 per accident) but some states do not. We not only recommend it on your auto policy but would also recommend adding it to your umbrella (personal liability) policy.

This endorsement will step in for expenses beyond the underlying auto policy limits. Your medical insurance could be adequate for some scenarios, but the umbrella policy endorsement would provide other benefits that health insurance won’t, such as lost wages or payments for pain & suffering. The cost for this endorsement is usually an extra $100-200 per $1M of umbrella coverage and we recommend at least getting a quote to see whether that’s worth the peace of mind.

We hope you found these tips helpful. We don’t sell insurance, but we’re happy to work with our clients’ brokers and agents to find what’s right for their situation. At Boardwalk, property and casualty insurance is reviewed for our clients every two years – even if nothing obvious has changed. Whether it’s saving on insurance premiums, helping update coverages, or just confirming that everything looks good, our clients have peace of mind knowing they are well protected.