Today’s Chances for Bad Investing Behavior: High

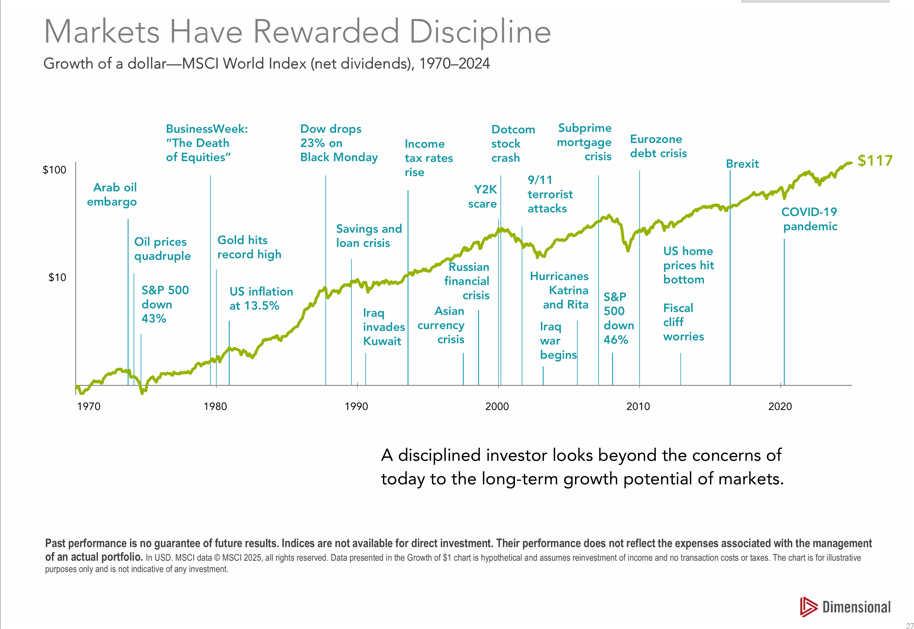
It has long been common knowledge that making emotional investing and money decisions can lead to poor results.  The field of behavioral finance has only more recently begun to document and quantify the impact. 

 A presidential election is always a source of uneasiness for investors.  Add to that our current backdrop of economic and geopolitical uncertainty and you get an environment fraught with opportunities to make decisions based on emotion or the behavioral biases that live within all of us.

 Therefore, I thought this might be a good time to share some of my favorite investing quotes and fun facts, in the hopes that at least one might resonate with you and help you navigate whatever negative or positive thoughts, news, or predictions come your way in the coming days, weeks, and months (and yes, years and decades as well!).

 Maintaining Discipline in the Face of Volatile Markets and Scary Headlines

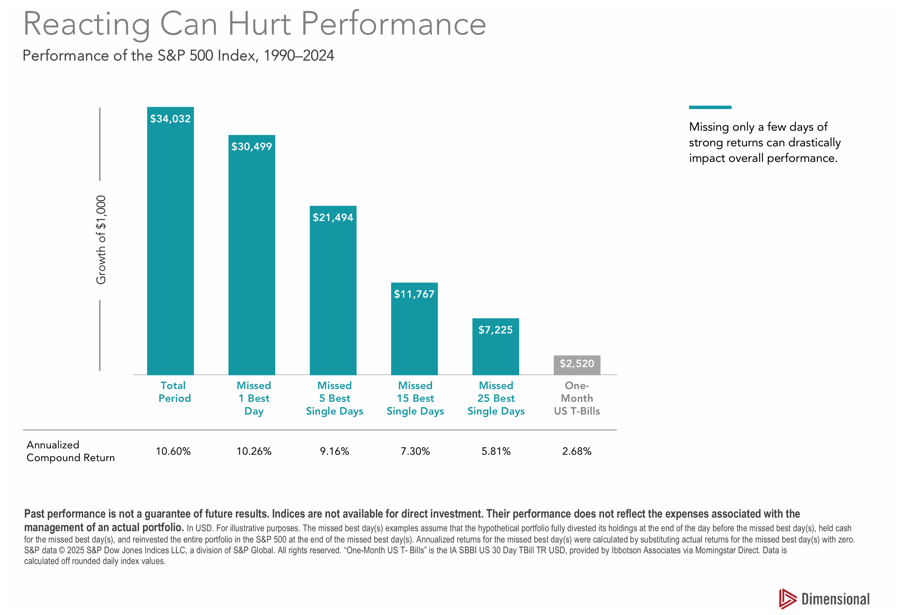
Humans are hardwired to be bad at this.  Our fight or flight response kicks in during moments of fear, telling us “do something!” when, in fact, doing nothing is very likely the better approach.  This is easier said than done.  A few financial firms have attempted to quantify the impact of bad timing decisions investors make.  Vanguard estimates the “cost” of bad investing behavior at up to 2% of portfolio value per year while Russell Investments estimates the return differential at 2.54% per year.  Morningstar reports two sets of returns for mutual funds: the actual fund return and what they call “investor return.” This is Morningstar’s estimate of what end-investors actually earn based on fund inflow/outflow data.  In aggregate, their most recent measurement is that investor returns lag the actual fund returns by 1.1% per year.

A genius is the man who can do the average thing when everyone else around him is losing his mind.

Save like a pessimist and invest like an optimist.

Your success as an investor will be determined by how you respond to punctuated moments of terror, not the years spent on cruise control.

Be fearful when others are greedy, and be greedy when others are fearful.

Tuning out the Noise

This is a difficult task.  We are bombarded with information from the 24-hour news cycle, friends and colleagues, and social media.  Bad news easily catches our attention because we feel the pain of losses more intensely than the pleasure of gains.  Remind yourself that bad news is priced into markets far more quickly than you can react.

The fact that bad news travels ten times faster than good news is what separates investors from market returns.

Pessimism just sounds smarter and more plausible than optimism. Tell someone that everything will be great and they’re likely to either shrug you off or offer a skeptical eye. Tell someone they’re in danger and you have their undivided attention.

All of us would be better investors if we just made fewer decisions.

Your portfolio is like a bar of soap – the more you handle it, the less of it you’ll have

Remember your Time Horizon

Keep in mind that we’re not risking capital in the markets that can’t stay invested for several years, allowing ample time for price recovery.  We know from experience that, at some point, riskier portfolios will suffer losses of 20%, 30%, 40% or more in a year.  It’s not if, but when.  We also know that, despite these losses, riskier portfolios will deliver higher returns over longer periods of time, which is often the only period that is relevant.

Time in the market beats timing the market.

Everybody in the world is a long-term investor until the market goes down.

We are here to support you in your financial journey in any way we can.  Please reach out if you need any reassurance about your portfolio strategy, maintaining discipline, tuning out the noise, or anything else!

The Magnificent 7 Ruled the Markets Last Quarter, Should This Change How You Invest?

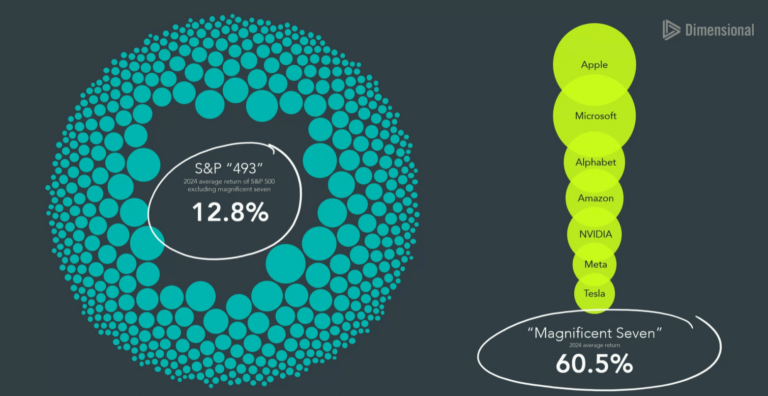
A familiar theme continued during the second quarter of 2024: US stocks led all other major asset classes, with most of this performance attributable to just a handful of technology companies. Last quarter’s commentary discussed why it continues to make sense to be diversified across global equities. This quarter, we’ll take some time to look at why US large cap stocks have performed so well recently and why, even against that backdrop, it still makes sense to diversify amongst US stocks.

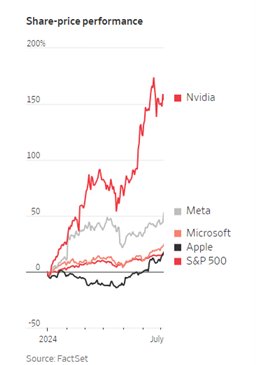
This year, Nvidia hit both the $2 trillion market capitalization (share price x shares outstanding) milestone and then in June, four months later, it eclipsed the $3 trillion mark. For a brief moment, it was the most valuable company in the world. This title has consistently been held by either Apple or Microsoft over the past decade. All three companies were worth over $3 trillion at the end of the second quarter. These companies, along with a few others, have contributed most of the US equity market’s return this year.

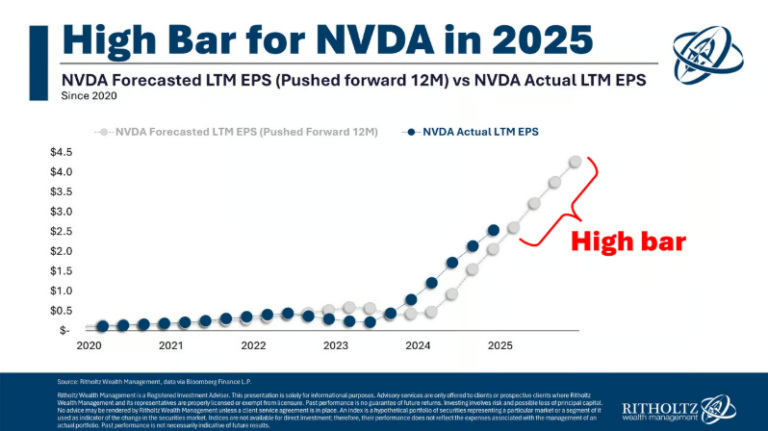
Nvidia rose 37% in the last quarter and has tripled in value over the last 12 months. As a result, it has contributed 1/3 of the S&P 500’s year-to-date return. Microsoft, Amazon, Meta, Alphabet, Tesla, and Apple – the other “Magnificent Seven” members – and Nvidia are responsible for about 60% of the S&P 500’s rise this year. This is abnormal, but there is reasoning behind it. Over the last year, Nvidia, Amazon, Meta, Alphabet, and Microsoft grew their earnings (profits) by 84%, whereas the rest of the market increased earnings by about 5% relative to the year prior. More importantly, these companies all exceeded the market’s expectations for earnings and earnings growth.

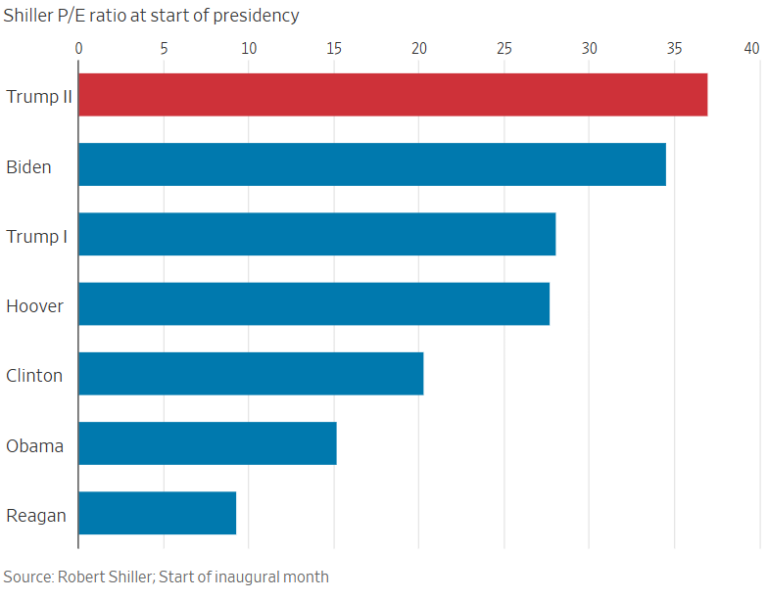
Analysts will often reference a P/E ratio (“price to earnings” ratio) to illustrate how expensive a stock is relative to that company’s profits. According to FactSet data, the Magnificent Seven stocks are trading at 37 times their expected earnings over the next 12 months whereas the S&P 500 trades at 21 times forward earnings. While recent fundamentals have supported stronger stock valuations for those companies (they have handily beat earnings expectations over the last year) time will tell whether they will continue to top lofty expectations.

Not only do those companies have massive revenue and profit streams, but they are also investing heavily in generative AI technologies and applications. You’d be right to think of it as an arms race! To get an idea of how much money is being poured into AI, consider this: the five companies I just listed recently accounted for 22% of all US research and development capital expenditures. Over the coming quarters, investors will pay close attention to how much revenue and profits those enormous investments will generate.

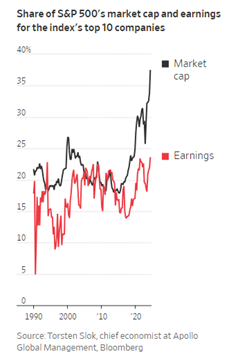
A major risk to investors in the US stock market is that as the largest US companies increase in value, lifting the S&P 500 higher, the index continues to become more concentrated. Right now, investors are so optimistic about the largest US companies that they are willing to pay outsized prices for shares of those companies (as indicated by the P/E ratios I referenced earlier). At the end of the third quarter, Apollo Global Management notes that the top 10 stocks in the S&P 500 make up 37% of the index while contributing 24% of its earnings. That’s the largest gap since 1990. 

Torsten Slok, Apollo’s chief economist puts it well by saying: “The problem for the S&P 500 today is not only the high concentration but also the record-high bullishness on future earnings from a small group of companies.”

If those heavyweights fail to deliver on growth and profit expectations, there will almost certainly be a stock market correction.

To “beat the index? when the largest names are only getting bigger, would require an investor to own even more than the representative portion of those stocks.

Of course, an outsized position in Nvidia doesn’t sound like a bad thing looking backward! But being less diversified only works if the right bets – at the right time – are chosen AND then properly exited before the tables turn. For long-term investors, being diversified amongst all areas of the market will produce better outcomes. It’s been a great year to be an investor in US equities – there’s no sense complaining about how it could have been better with an even more concentrated gamble on the largest tech stocks.

As we all know, diversification means that portfolios will hold both the best-performing assets and the laggards. Over time, combining assets with high expected returns but different paths toward those returns (i.e. non-perfect correlations) provides investors with a better risk-adjusted return. Said another way, diversified portfolios don’t swing as wildly – which provides investors with greater peace of mind and, for retirees, could prompt them to be more confident in their spending levels.

At Boardwalk, we have our clients’ long-term goals in mind and we work to help our clients be comfortable and confident in their financial future. 

What Should the Financial Media Focus On?

I have a pet peeve with financial media and news reports on the stock market in general.  Well, I actually have a lot of pet peeves about the financial media, but this commentary will discuss why one in particular can create issues with expectations vs. reality.  

When is the last time you heard a TV news anchor recite the day’s market movement of the MSCI EAFE or the Russell 2000 Value indices?  The US financial media generally only reports the returns of three measures of the stock market: the S&P 500, the Nasdaq, and the Dow Jones Industrial Average (“the Dow”).  Unfortunately, all of these are slightly different measures of the performance of US large company stocks—only one segment of the diversified portfolio owned by most investors.  For a Boardwalk 60% stock, 40% bond portfolio (“60/40”), the information provided by the financial media tells you about the returns of only 11.5% of the portfolio (and 19% of the equity portion of the portfolio).

Why do we only have 19% of the equity allocation in US large company stocks?  Perhaps a quick sidebar on diversification would be helpful before we proceed.  Investors and advisors divide up investment markets in many different ways: stocks vs. bonds, large vs. small company stocks, “growth” stocks vs. “value” stocks, and developed vs. emerging economy stocks.  Beyond stocks and bonds, there are also Real Estate Investment Trusts (REITs), commodities, private equity, and other categories.  The reason we categorize these segments of the market—called “asset classes”—differently is because they tend to have different risk and return characteristics and are not highly correlated with each other.  If different asset classes have attractive long-term expected returns but “zig and zag” differently, blending them together can provide a smoother “ride” for the portfolio while still producing a solid long-term return.

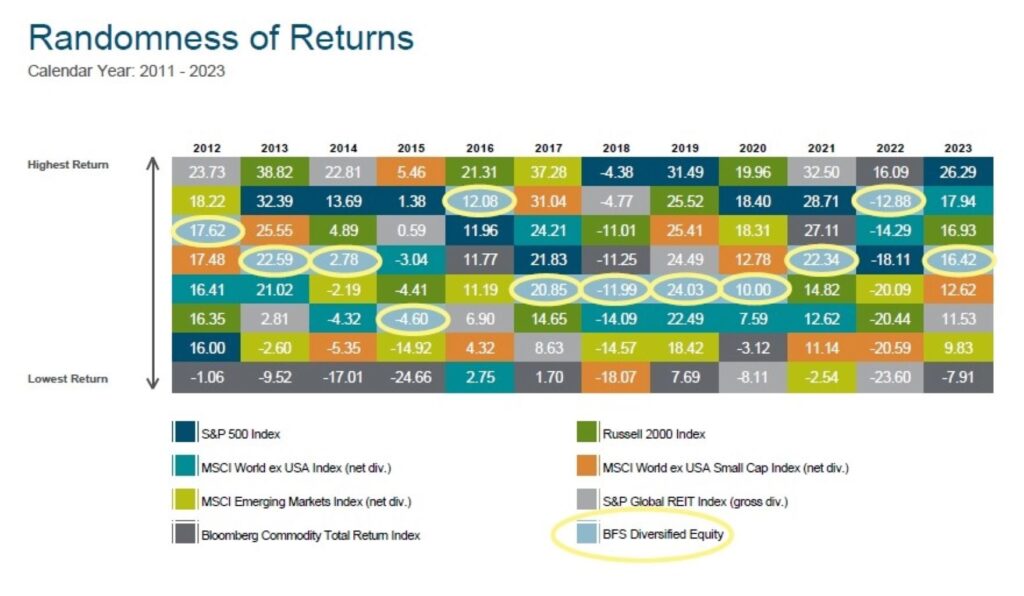
The chart below is a great reminder of why we diversify.  It shows the major equity asset classes, each with their own color, and ranks them vertically in each year’s column from best annual return down to worst.  The light blue box with red outline is the blended return of a diversified equity-only portfolio that includes all the asset classes shown in the chart.  It would be nearly impossible to predict which asset classes would be near the top of the column each year, but you can see that the diversified equity portfolio provides a better-than-average return without requiring any predictions.  It’s never the worst performing, but it will never be the best performing either (that’s mathematically impossible). 

Now back to those media reports. The returns on the S&P 500, the Nasdaq, and the Dow have been remarkable over the last 10 years. So remarkable, in fact, that other segments of global equity markets have not been able to keep up. The chart below shows the annualized returns of various asset classes over the 10 years ended March 31, 2024.

Typically, the best performing asset class rotates more frequently, but when the outperformance of any one asset class is as large and as persistent as the current run for US large company stocks, the diversified portfolio return can lag the top performer significantly.  To further pile on: when the outlier asset class is also the most visible (i.e. US large company stocks thanks to the attention provided to them), the urge to “do something about it” can be strong. 

Would “doing something” mean loading up on stocks of large US companies? Would it mean loading up on stocks in the “Magnificent Seven” such as Nvidia that have been on a historic run?  If that seems risky, you’re right, it is.

After an asset class dominates performance for a long period of time, it tends to either become overvalued or the other asset classes look very attractively valued relative to the recent top performer.  Looking at the last notable period where US large company stocks enjoyed significant outperformance, the returns tend to underperform in the following period. The best recent example of this was the late 1990s when internet and technology stocks were unbeatable during the “dot-com” era.  By 2003, the fortunes of those stocks had reversed quickly.  Below are the returns of various asset classes for the five years ended 12/31/1999 and those of the subsequent 10 years.  While this doesn’t mean the fortunes of these asset classes must immediately reverse, it is certainly more likely than five years ago.

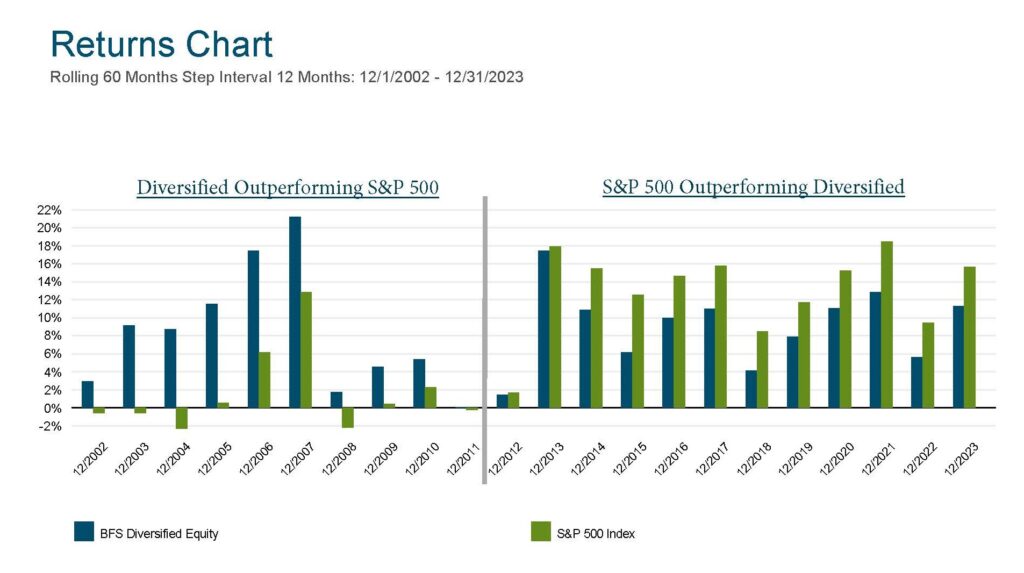
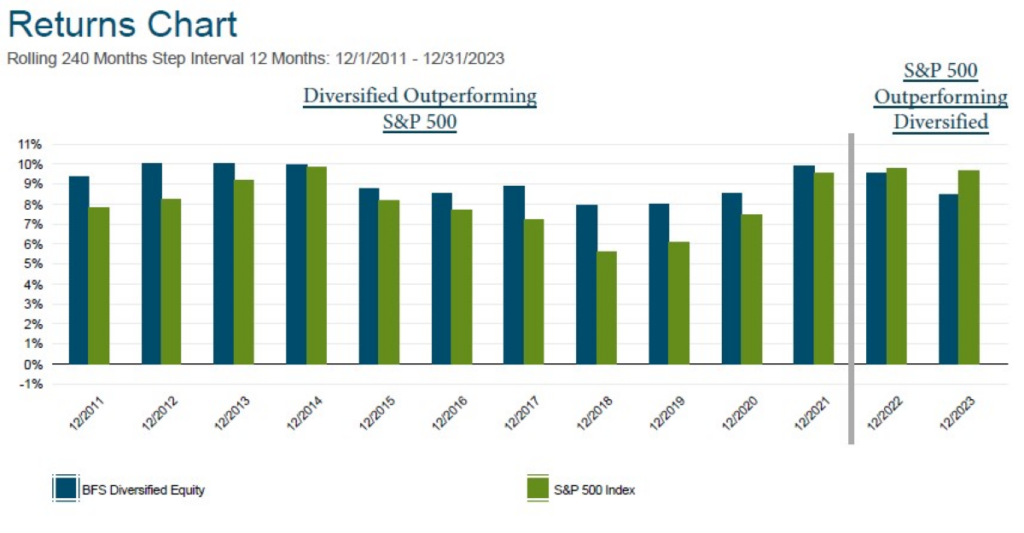
Rolling period returns can be helpful in zooming out and viewing longer periods of time in single data points.  In the series of below charts starting with 5-year rolling returns, then 10-year, and finally 20-year rolling returns, you can see how acute the S&P 500 outperformance can be over 5-year periods, but as you lengthen the time period to 20 years, it’s only the two most recent 20 year observation where the S&P 500slightly outperforms the diversified portfolio (and only after the staggering 10-year outperformance of other asset classes seen in the chart above. 

5-Year Rolling Chart

10-Year Rolling Chart

20-Year Rolling Chart

Should investors have been able to predict this strong period of US large company outperformance or recognize the trend early and add exposure?  So called “tactical asset allocation funds” have the flexibility to adjust their mix of asset classes based on their forecasts.  If there was a clear signal that one should have bet heavily on US stocks, those funds would have done it.  They didn’t.  Instead, they have failed miserably relative to a fixed (non-tactical) asset allocation, as pointed out by Morningstar in articles over the last few years (here and here).

We believe that the equity portion of our clients’ diversified portfolios will be competitive with the S&P 500 over their investment time horizons, but there will most certainly be periods of time when a specific asset class leads the pack and outperforms a diversified equity portfolio over a multi-year period. This does not mean that diversification is broken.  In those moments, it may be helpful to keep in mind one of my favorite maxims regarding portfolio management: “A portfolio is like a bar of soap.  The more you handle it, the less of it you have.”

Should Expert Predictions and the Financial Media Guide Your Investment Decisions?

Summary

As great of a year 2023 was for investors, it’s even more notable how much better than expected the year turned out. We dig a little deeper into how the past few years have fared compared to expert predictions.
The commentary below proves expert predictions are probably better described as guesses. Basing your investment strategy on what the media says could get you into trouble.


2023 was an amazing year for investors, even though no one expected it! Rewinding to one year ago, investors were still in the doldrums after a horrible 2022 that saw both stocks and bonds decline by double digits. On the docket for 2023 was a year full of interest rate hikes, inflation pressures, wars, and – so we all thought – a recession. As a result, many investors were content to accept a (finally!) decent return on cash and just wait out the year. The Wall Street Journal summed it up well: “Almost no one thought 2023 would be a blockbuster year for stocks. They could hardly have been more wrong.”

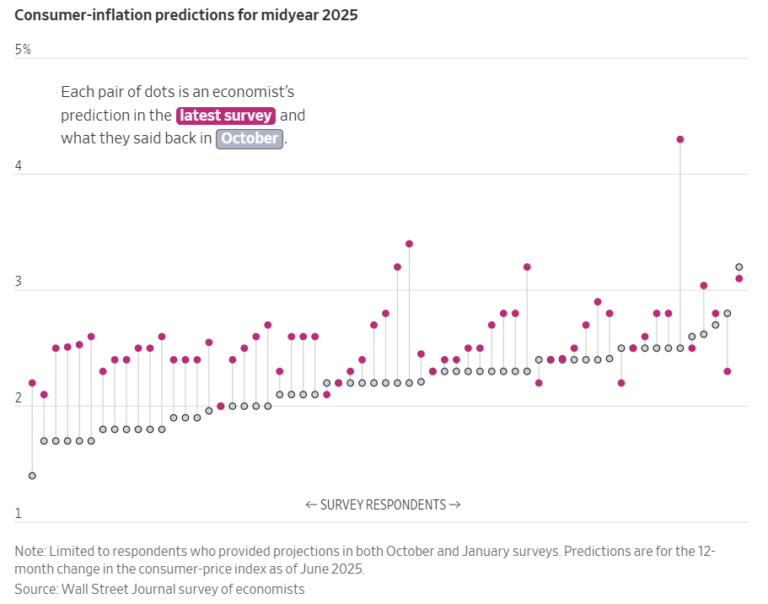
Despite what the investment strategists, economists, and media pundits may say, it will be very difficult to correctly predict how the economy and your investments will perform in 2024. Even if someone predicts accurately in one area – say, geopolitical risks or corporate profits or consumer strength – how the market reacts and moves during a year is so complicated that few, if any, can be right enough to make a profit off it on a consistent basis. Because not only does someone have to address data outcomes or event-specific risks, but that investor would also need to predict how human behavior reacts to that myriad of interwoven factors.

The last four years are a great string of examples for this.

2020:

  • What was predicted: Well, we’ll give everyone a “pass” for 2020.
  • What happened: A global pandemic, of course. In investing we call these “black swan” events – world-changing events that no one predicts but inevitably surface occasionally.
  • How markets performed: Despite a historic crash in the spring of 2020, everything did quite well to end the year. The S&P500 return was 18.4% for the calendar year.
  • Verdict: No one predicted the violent crash nor the rapid recovery in 2020.

2021:

  • What was predicted: A continued economic recovery, but still pretty average market returns. On the high end, some predicted double-digit returns but there were just as many experts forecasting a flat stock market.
  • What happened: Despite persistent effects from the virus, the US economy surged back to life as consumers just shifted where they spent money and companies adapted. Inflation was the “consequence” from combining a robust, stimulus-fueled recovery with supply chain issues, but during 2021 it still hadn’t hit full swing yet.
  • How markets performed: The S&P 500 hit 70 new all-time highs on its way to a monster 28.7% gain.
  • Verdict: At this point the pandemic still wasn’t behind us. So, it’s understandable how few anticipated the “V-shaped” economic recovery, and none nailed just how stellar market returns would be.

2022:

  • What was predicted: Maybe it was the rose-colored glasses of 2021 since, despite high valuations and a telegraphed set of Federal Reserve rate hikes to combat inflation, forecasters said markets would be up.
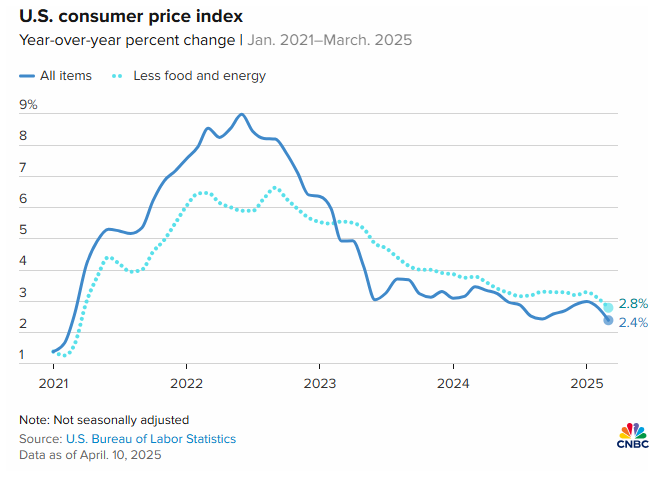
  • What happened: Interest rates surged at the fastest pace in decades and US inflation peaked at 9.1% in June. The economy still managed to grow about 2%, but there was widespread pessimism.
  • How markets performed: The S&P 500 posted its worst year since 2008 (-18.1%) and bonds had their worst year ever (the Bloomberg Barclays Aggregate Index fell over 13%). Areas with the highest valuations and best 2021 returns fell the most in 2022: technology companies, “meme stocks,” cryptocurrencies, etc.
  • Verdict: Another miss!

2023:

  • What was predicted: 85% of economists in a Financial Times poll expected a US recession in 2023 and the IMF said that a third of the global economy would be in recession along with the United States. And it wasn’t just economists and rap artist CardiB…we all figured it would happen in 2023.
  • What happened: Not only did the US avoid a recession, but the global economy managed better than expected on average. Few would have also predicted a banking crisis, a government debt showdown, or Artificial Intelligence mania to fill the year.
  • How markets performed: It was a banner year for stocks (S&P 500 up 26.3%), and everything did well in the 4th quarter rally.
  • Verdict: No doom and gloom. And even for the optimists, investment returns exceeded all forecasts.

It’s clear that relying on future forecasts would have been a dangerous investment strategy over the last four years. Fear and greed, the opposing sides that encompass much of human investing behavior, influenced investors to be overly cautious heading out of the covid crash and 2022 declines but also overly confident after 2021’s rally. Just imagine the difference in portfolio return had you heeded the collective advice of the prognosticators vs. sticking with a disciplined investment strategy!

Poor predictions aren’t just a post-covid phenomenon (2020 onward). A piece by the New York Times looked at a 24-year time period: 2000 through 2023. Rather than just giving a “verdict” as I did above, they measured the difference between the median forecast and actual returns of the S&P 500. For example, in 2022 a median forecasted rise of 3.9% was wrong by a margin of ~24% given the S&P 500’s 18% fall. So, how far “off” is Wall Street each year?

“…the median Wall Street forecast from 2000 through 2023 missed its target by an average 13.8 percentage points annually…”

Talk about a wide margin of error! If your advisor, YouTuber, or CNBC host is touting their market prediction abilities, the evidence is clear: they just got lucky and that will be very, very difficult to repeat consistently. Despite ever increasing and timely data, market transparency, and better understanding of investor behavior, reliably forecasting the stock market remains elusive. In that light, a humble and disciplined approach to investing is best.

At Boardwalk, we help clients pick a portfolio that’s right for them and that they can stick with during rough times – this strategic approach is the proven winner in investing over the long run. Tactical investing (zigging and zagging amongst assets) results in poor investment outcomes on average. Instead of trying to identify how the market is wrong, we seek to harness the enduring relationship between risk and return by emphasizing the risks the market has rewarded consistently and persistently for long-term investors. Then, we go the extra mile to make sure that the things we can control – like tax efficiency, rebalancing, or getting excess cash to work –remain the focus to enhance wealth creation over time.

Our clients share that they enjoy peace of mind knowing their low-cost, diversified portfolio is designed to meet their long-term goals and promote financial security. Without knowing what’s in store for 2024, we hope these truths can provide you with confidence for the years ahead, no matter what they bring.

Can Inflation be a Good Thing?

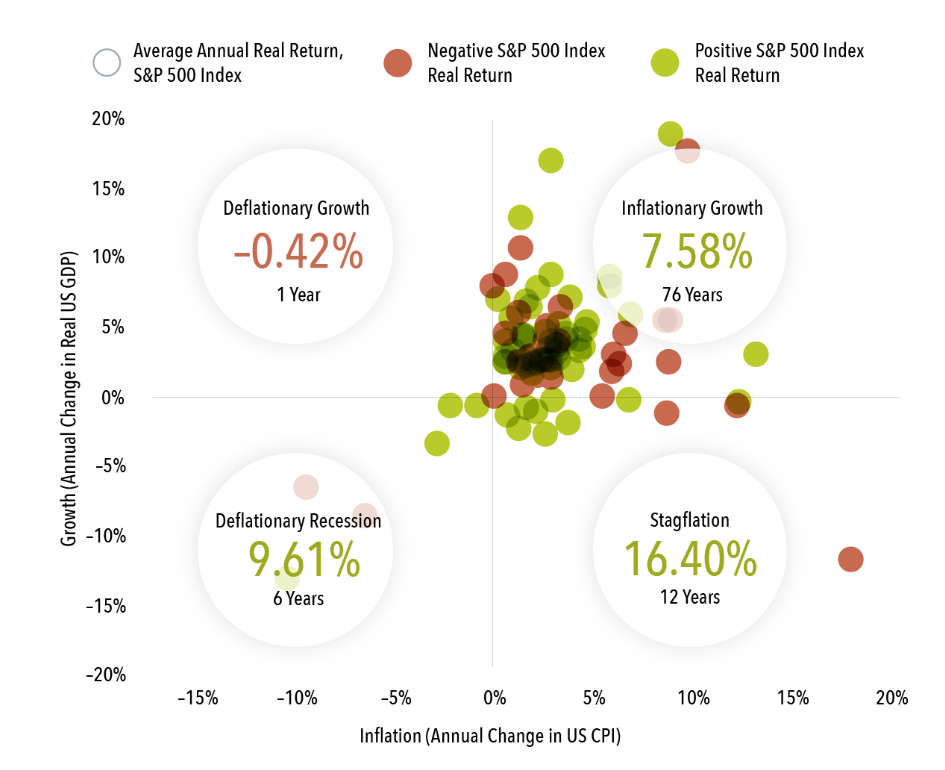
When it comes to inflation, a small amount of it is healthy for the economy. That’s because when consumers and businesses expect prices to continue rising, they are more likely to buy something today. Strong current demand spurs growth on the supply side of the economy since businesses expand their workforces and production to meet this demand. As you can see, low and consistent inflation creates a virtuous cycle that is good for economic growth. In fact, the opposite scenario – deflation – would likely be more problematic than moderate inflation. The US Federal Reserve has set a target of 2% for core inflation with the duel aim of avoiding deflation or high inflation.

As we transition ‘back to normal’ there has been high consumer demand, massive governmental stimulus, supply chain issues, and global shortages of raw and manufactured goods. The Federal Reserve anticipates that most of these inflationary forces will abate. Caught between managing inflation and spurring growth, they’ve emphasized their goal of bringing employment back to pre-pandemic levels. If inflation proves to be less transitory than most economists expect, the Federal Reserve will likely take steps such as raising interest rates to avoid overheating the economy.

Inflation becomes dangerous when it causes too much growth and prices rise faster than wages, with everyone worse off in terms of purchasing power. To help counteract this effect for many retirees, the Social Security Administration bumped benefits for 2022 by 5.9% (compared to an annual average adjustment of 1.65% over the last decade)! For wage earners, incomes have and should continue to rise. So, for most clients there is a good amount of insulation against inflation via higher cash inflows. We also recommend appropriate cash reserves since cash is very susceptible to inflation. The inflation-adjusted ‘return’ of cash is virtually guaranteed to be negative. The risk of losing purchasing power can be mitigated through long-term, thoughtful investments and cash flow planning.

When it comes to the portfolio, we’ve designed the investment allocations with risks – like inflation – in mind.

  • Stocks typically hold up well against inflation in the long-term because companies can pass higher costs along to consumers. The bulk of most client portfolios are invested in US, developed international, and emerging market equities.
  • Bond returns may be muted or negative on a “real” (inflation-adjusted) basis in an inflationary scenario. This is especially true if interest rates rise – which is likely if the Federal Reserve deems it necessary to rein in inflation.
    • We have positioned portfolios with a healthy allocation to short-term bonds to diminish this risk. Shorter maturity bonds are less impacted by rising interest rates because they mature more frequently and can reinvest into higher interest rates.
    • We also avoid any allocation to long-term bonds right now because those would be most significantly hurt by rising interest rates. Yields at those maturities are not compelling enough for this large risk.
  • Commodities and real estate are “hard assets” that should do well in an inflationary scenario.
    • Real estate investments provide a hedge due to land scarcity and because rents tend to adjust with inflation, providing income protection.
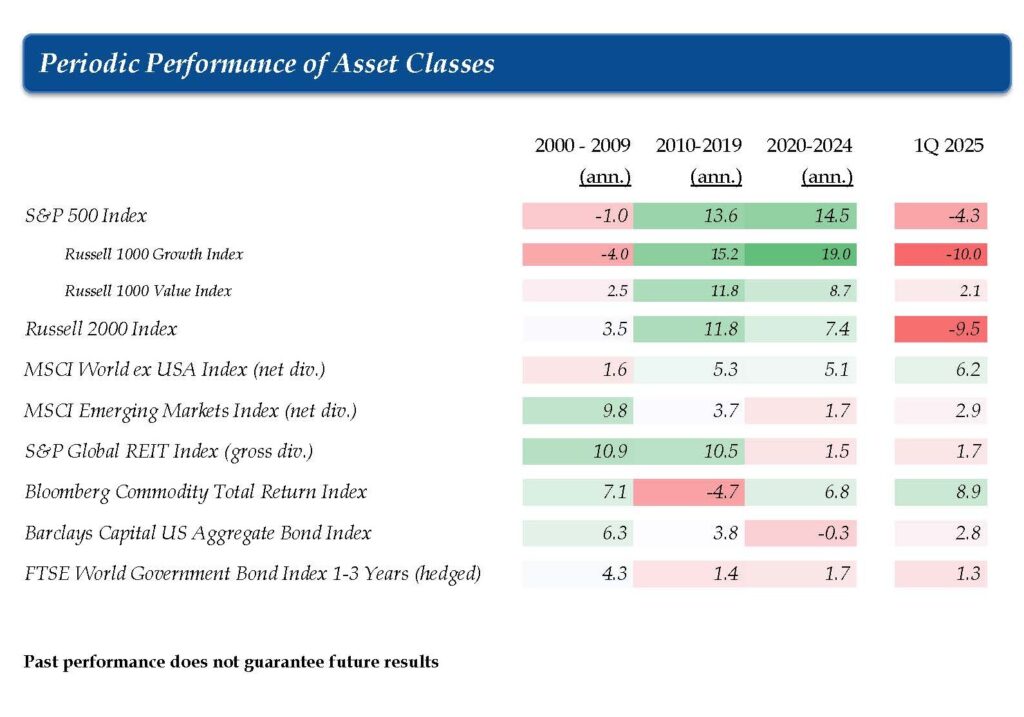
    • Commodities have been the best performing asset class this year in part due to inflationary factors. While a laggard in the low yield and low inflation environment of the late 2010s, commodity funds have done well as an investment because prices for goods as far ranging as copper, lumber, and crude oil have all risen considerably this year.

No one knows which portfolio risk will present itself next, so we want to stress the importance of remaining diversified and disciplined in achieving long-term investing success.  If you have any questions or concerns about the positioning of your portfolio, let’s discuss it at your earliest convenience.