Silicon Valley Bank Explained

If you were not familiar with Silicon Valley Bank (SVB), it’s likely that you have heard about it now – and not in a good way. Unfortunately, SVB on Friday became the biggest bank to fail since the global financial crisis in 2008. Since then, the Federal Reserve, U.S. Treasury, FDIC, and even larger banks stepped in to ensure liquidity, calm depositors, and stabilize markets. While it may be an appropriate time to revisit whether you have enough FDIC coverage for your money held at a bank (more on that later), the consensus view is that the overall banking system is well capitalized and has ample liquidity.

So how did SVB fail? SVB held long-term bonds that had lost significant value as the Fed hiked rates. In order to meet withdrawals from its accounts, SVB had to sell these bonds at a loss. As the bank came under stress, more depositors withdrew funds. This required SVB to sell additional holdings at a loss – and the cycle fed on itself until regulators stepped in to close the bank down. The bank had a heavy concentration of start-up and technology-related firms among its depositors and customers. So not only did the bank suffer from tightening liquidity and rising rates, but its customer and depositor base did as well. This was a major contributor to why other banks have not experienced the dramatic bank run, and failure, that SVB did. Exposure to concentrated areas of the market have proved to be detrimental to other banks: Silvergate Capital and Signature Bank of New York recently shut down after their heavy participation in the crypto space caught up with them.

Contagion is when a disturbance, like SVB failing, spreads within the financial system. Even during last week’s panic – and certainly after the reassuring announcements on Sunday – this risk is considered to be low. Why? SVB, Silvergate, and SBNY had concentrated exposure and limited entanglement with other financial institutions. This was unlike the large banks in the lead-up to the global financial crisis. In 2008, there was significant financial exposure between giant banks via complex securities, so one bank’s losses quickly turned into a threat for the whole industry.

The Federal Deposit Insurance Corporation (FDIC) ensures that depositors at banks will receive any insured funds. On Friday, depositors at SVB did not know whether they would recoup any of their money above the FDIC limits. Regulators have since stepped in to shore up confidence in the banking sector: all customers of the failed SVB have access to their money today and other banks that might experience heightened withdrawals will have easier access to liquidity (borrowing from the Federal Reserve).

A Brief Review of FDIC Coverage

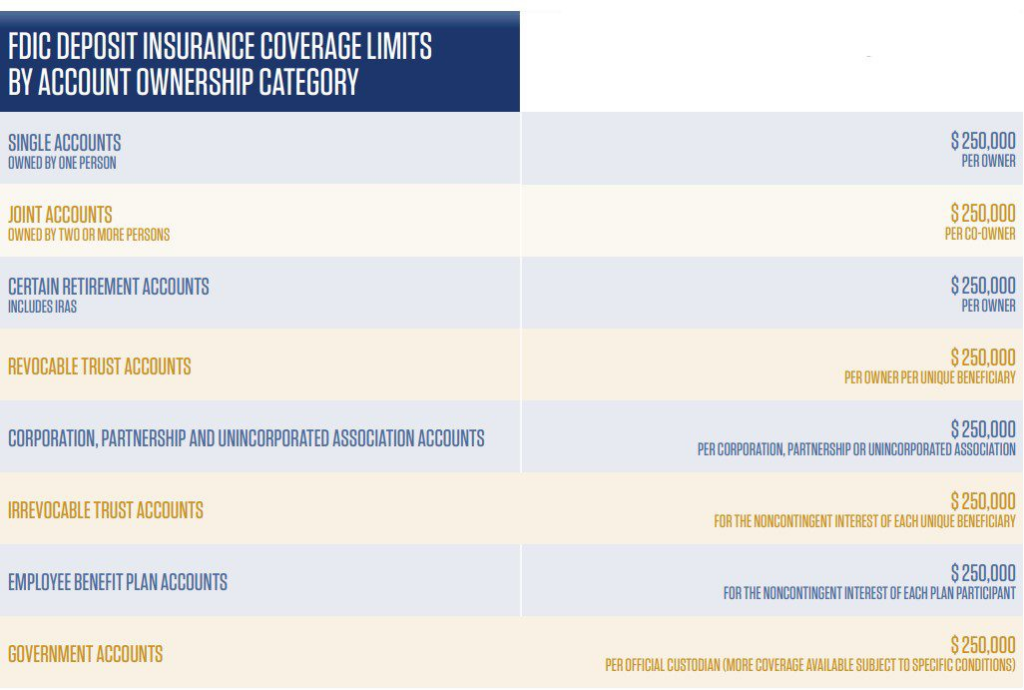
While the FDIC, U.S. Treasury Department, and Federal Reserve have quickly stepped in to support depositors beyond the traditional FDIC limits and likely would do this for other banks that came under duress, there is no guarantee. As such, one step you could consider taking is to spread out any bank balances in excess of FDIC limits, if any, to other banks (or new account types at the same bank). See the below chart as a reminder of FDIC insurance limits. Remember that all of these limits below are per bank.

Example 1: if Tim opens an individual account at five different banks, each of them is insured for up to $250k ($1.25M total).

Example 2: if Tim has an individual account and a joint account with Jenny at the same bank, the individual account is insured for up to $250k and the joint account is insured for up to $500k for a total of $750k. They could replicate these accounts at a second bank and double their total FDIC coverage.

Cash at TD Ameritrade and Schwab has always been allocated to a FDIC insured deposit account where the funds are held at one or more banks. These deposits are insured by the FDIC up to $250,000 per account, per bank.

Please contact us if you have any questions about the SVB failure or restructuring your bank accounts to increase FDIC coverage.

The Inflation Story

When we look back at 2022, there will be plenty of material for the history books. Few, if any, predicted the size and scope of the declines and volatility seen this year. So, while it’s cliché, that is exactly why we emphasize time in the market rather than timing the market. It’s impossible to consistently move in and out of the market with good timing. Rather, investors are rewarded for taking on thoughtful risk within a diversified portfolio and sticking with that strategy despite years like this one.

The Inflation Story

For decades, we’ve been operating in a world with falling interest rates, low and steady inflation, globalization, and rapid technological progress. Technology and globalization have worked together to make the global economy more efficient, more stable, and more open. As such, inflation was low and stable, allowing policy makers and economies to enjoy low interest rates. The pandemic flipped everything upside down and interest rates have surged to counter the highest inflation in 40 years, as seen in the chart below from Morningstar. 2022’s ten Fed rate hikes (horizontal axis) moved the Fed funds rate higher by 4.5% (vertical axis).

Higher interest rates seem to have helped dampen demand. Coupled with improving supply chains and falling food & gas prices, we’re moving in the right direction: December’s annualized inflation rate of 6.5% is a good deal below the June high of 9.1% here in the US. But it’s still a far cry from the Fed’s 2% target rate. The ongoing concern is whether the Fed’s delicate dance – raising rates enough to bring down inflation but not high enough to cause a serious recession – can be achieved.

The uncertainty of inflation’s path and the economy’s resilience are reflected in asset prices, and it’s a big part of why 2022 has been difficult for investors. As we highlighted last quarter, Boardwalk is here to help our clients focus on meeting their short and long-term goals and stay invested through market turbulence. Evidenced by returns in 2021 and 2022, investors won’t ever receive the average return for a portfolio in a given year. But staying disciplined with a strategy will bring investors closer to the expected annual average return – and their goals – over time.

Mean Reversion

“Reversion to the mean” refers to the concept that statistical observations return to their average (mean). Take a coin toss for example – there could be a decent stretch of heads or tails (the Guinness World Record is 8 head tosses in a row). But if you flipped a coin enough times it’s extremely likely that the rate of occurrences for either side would revert towards 50%. In investing, this phenomenon is called “mean reversion” and it’s the theory that returns, prices, growth, etc. move back towards their long run average after experiencing a period above or below that trend line.

It’s a powerful force. At times, there is a systemic shift in the data that would cause the long-term future trend to be meaningfully different than in the past. However, when the “this time is different” assertion arises, history tells us that it’s usually not different – it’s just that mean reversion hasn’t occurred yet. Let’s look at two examples of this in investing.

Our 2021 year-end commentary featured the wide gap between valuations for the growth style of investing verses its value style counterpart. 2022 proved to be a year of significant mean reversion. Global value stocks had their largest outperformance since 2000, coming out ahead by 21%. This has certainly helped our recommended holdings, given their value tilt.

The cyclicality of performance leadership between US and international stocks could point towards another area of the markets that’s ripe for mean reversion. Looking back at the last 10 years, US stocks returned 12.1% per year through the end of last year while international stocks lagged with a 4.6% annual return for US investors. That great stretch for US stocks came after the S&P 500 had a “lost decade” between 2000-2009 – it lost money while international stocks dominated. Currency returns impact international stock returns for US investors, and we’ve recently had a period with a very strong US dollar. The last time it was this strong was in the early 2000s and a weakening dollar during the rest of that decade produced a tailwind for international stock returns. Heading into 2022, valuations were also stacked in international stocks’ favor. As the dollar began to weaken in the fourth quarter of 2022, international stocks returned 16.2% compared to 7.6% for large US stocks. This doesn’t mean we should abandon US stocks all of a sudden. We think that maintaining both US and international diversification makes the best use of the global opportunity set over the long run, regardless of which area has had better performance recently.

Looking Back To Look Ahead

As we begin 2023, no one knows how markets will fare. Inflation and economic growth will likely persist as headlines. And while corporate earnings and households have been able to hold up against rising rates and record inflation, many expect this year to reveal the “lagged” impact of these forces. Most economists are expecting a recession within the next two years. The equity and bond markets are forward looking, however, so the current probability of these risks is factored in. Better-than-expected news could usher in strong portfolio returns even amid deteriorating conditions.

Looking back at 60% stock/40% bond portfolio returns since 1926 shows that the years after a 10%+ drawdown often post strong positive performance (data compiled by Dimensional Fund Advisors). Of course, we construct our recommended 60/40 portfolios to include much more than just the S&P 500 and US Treasuries, but that’s the typical mix that Wall Street references. That 60/40 portfolio was down 14% in 2022.

Patience and discipline can be in short supply when investors experience rough waters. But that’s also when future expected returns are often at their highest. Looking backward at the stellar returns exiting a market crash, investors habitually remark that they wished they maintained their stock holdings or even added cash to their portfolios when down. However, in the midst of a pandemic or global financial crisis it can be very difficult to do so. Despite the uncertainty ahead, we believe this bear market will eventually prove to be a similar opportunity for disciplined, long-term investors.

We know maintaining peace of mind after a year like 2022 is easier said than done and we’re here to discuss any concerns or questions you may have.

Sequels are Never As Good – Are They?

Sequels are never as good – are they? Well, that may just hold to movies. There’s plenty of new tax & retirement planning implications from SECURE Act 2.0, passed Dec. 29, 2022.

The original 2020 act had many impactful provisions, but we’ll remind everyone of one very significant change: money in retirement plans that is inherited by non-spouse beneficiaries generally must be taken out (and taxed) within 10 years. Previously, tax law allowed distributions from inherited retirement money to be stretched over the course of the beneficiary’s lifetime.

The retirement and tax planning implications from the SECURE Act 2.0 are far broader – there are over 100 provisions – but no single change is as impactful as the elimination of the stretch IRA in the first bill. Given the breadth of provisions, we’ll focus on three of the most important areas for our clients and their families.

Required Minimum Distributions:

The first Secure Act pushed the required age at which distributions must be taken from retirement plans back from age 70.5 to 72. If you were was born before 1951, there’s no change since you’re already taking distributions. For those born between 1951 and 1959, RMDs now begin at age 73. If you were born after 1960, the first RMD has been pushed back to age 75.

What’s the impact on me?

  • For those who started taking RMDs in 2022 and prior, there’s no impact.
  • For everyone else, there will be a longer gap of time between retirement and your RMD age. The potential for lower income during that “gap” allows for additional tax planning – such as Roth conversions, taking capital gains at 0% or 15%, and even taking a distribution from a retirement plan voluntarily while in a low tax bracket. It also means your tax rate on distributions from age 73/75 through the end of your life could be higher, since there will be more income those years.

There are a number of other provisions relating to distributions as well – two of which we discuss below.

  • For those that are charitably inclined: there’s no impact to the age at which a “qualified charitable distribution” (QCD) can be made (age 70.5). However, the wider gap between when someone may take RMDs and their age 70.5 opens the door to more tax planning opportunities.
    • There are several other provisions related to QCDs that don’t apply to many retired givers, such as an inflation-indexed maximum and a one-time ability to fund a split-interest entity (e.g., a Charitable Remainder Annuity Trust).
  • Lastly, we’ll note that there’s a provision allowing a spouse to elect to take RMDs as if he/she was the original IRA’s owner. It gets complicated, but this could make sense for the older spouse to elect before a younger spouse passes away so that the older, surviving spouse can use the decedent’s life expectancy to delay and stretch out required distributions.

Next up: there were many provisions related to Roth contributions. Notably, this bill did not close the ability to make “back-door Roth IRA” contributions. Rather than restricting Roth access, the bill’s various provisions expand access to or in some cases even require Roth contributions instead of the traditional “pre-tax” contributions. The idea behind why Congress is expanding Roth features is straightforward: it benefits the government via higher current tax revenue, and it helps savers via additional opportunities to grow tax-free wealth. Here are some details on two of the more interesting provisions:

Catch-up Contributions:

Effective in 2024 and for plans offering a Roth option, high wage earners will be required to contribute after-tax money via the Roth option of a retirement plan for any catch-up contributions. High wage earners are defined as making at least $145,000 from the employer whose plan the catch-up contributions are being made into. Catch-up contributions are allowed for employees age 50+. For 2023, after contributing the regular maximum of $22,500 into a retirement plan, employees age 50+ can still make their optional catch-up contributions of $7,500 with pre-tax money.

  • Further, catch-up contributions for participants aged 60-63 will be bumped up to a maximum of 150% of the regular catch-up amount. Though this provision takes effect in 2025, if it did apply to 2023 contributions, the “bumped up” maximum would be $11,250. Keep in mind that all this would have to be after-tax wages going into the Roth portion of the plan starting next year.

529-to-Roth Transfers

Starting in 2024, it will now be possible to transfer money leftover in a 529 plan to a Roth IRA for the beneficiary. In the past it usually didn’t make sense to fully fund a 529 plan since earnings on non-qualified withdrawals are subject to taxes and a 10% penalty. But now that there’s a release hatch for excess dollars, there will be more client situations where attempting to fully fund college with 529 plans will make sense. There is still some cloudiness that the IRS will clarify but as the law is written this release hatch is here to stay. Here are some major restrictions on this new ability:

  • The transfer must be a direct rollover into the Roth IRA of the 529 plan’s beneficiary. It can’t go to the owner’s Roth IRA.
  • The beneficiary must have earned income during the year of the rollover. However, the income limit that normally applies for Roth IRA contribution eligibility will not apply for these rollovers.
  • The IRA contribution limit still caps the total amount that can go into the Roth IRA each year ($6,500 in 2023). The maximum applies to the combined total of contributions and rollovers from a 529 plan – no doubling up!
  • The 529 plan must have been maintained for at least 15 years and money contributed within the last 5 years cannot be moved into the Roth IRA.
  • A lifetime transfer maximum of $35,000 applies to each beneficiary.

As you can see, these limitations mean that 529 plans should still be used with education funding as the intent. But this provision will provide flexibility to fund a 529 plan more aggressively if considered along with cash flow, retirement plan strength, and estate planning considerations.

There are over 100 provisions in the SECURE Act 2.0 – so we’ve only scratched the surface when it comes to the breadth of new changes. However, these are some of the most applicable changes for Boardwalk clients. Please let us know if you’re interested in learning more about the SECURE Act 2.0 and how it applies to your situation. But rest assured, we will be bringing planning considerations to you as we meet – including any financial planning recommendations based on the other provisions not outlined here.

Recession and Your Portfolio

“No man ever steps in the same river twice, for it’s not the same river and he’s not the same man.” – Heraclitus

This insight from an ancient Greek philosopher is a relevant way to consider financial markets. Many parallels can be drawn between the financial markets today and those of years past, including what things looked like heading into prior recessions. It’s very possible we’re already in – or will soon experience – a recession here in the United States. GDP contracted 1.6% in the first quarter of 2022, and the widely used definition of a recession is two consecutive quarters of negative GDP growth.

Research shows that market downturns – often contemporaneous with recessions – are, on average, accompanied by positive returns over subsequent one-, three-, and five-year periods. Through the first two quarters of 2022, the S&P 500 has fallen 20%. On average since 1926, a 20% decline in the value of the total US stock market had positive cumulative returns of 22.2% over the next one-year period, 41.1% for the subsequent three-year period, and was up 71.8% after five years. Similar returns have occurred for smaller (10%) or larger (30%) drawdowns. Here’s an interactive exhibit compiled by Dimensional Fund Advisors showing returns, inflation, and other metrics surrounding past recessions that you may find interesting to read in conjunction with our commentary below.

In the 4th quarter commentary for 2021, we pointed out some of the similarities to the US market of the dot com era. In particular, valuations were frothy. Depending on the metric, prices for publicly traded growth stocks had eclipsed their tech bubble highs of two decades prior. While the timing was never certain, that’s a recipe for a healthy pullback in the stock market. This year has featured dramatic declines for (previously expensive) shares of growth companies to the point that some are even getting picked up by value-style mutual fund managers! The bursting of the tech bubble took several years and a mild recession followed in 2001. It’s possible that today’s market also needed a healthy correction to valuations and a cooling of excesses (such as the NFT of Jack Dorsey’s First Tweet selling for $2.9M and then losing 99% of its value). Like Heraclitus would say, however, it’s not the same “river” and investors crossing today have many other currents to consider.

Inflation during the 1970’s consistently registered in the double digits. Having peaked about a year prior to the onset of the 1973-75 recession, the US stock market fell over 46% before hitting bottom. Occasionally the term stagflation gets tossed around as a risk facing the economy today. It’s a period with both flagging growth and high inflation. America experienced this in the 70’s and it is a scenario the Federal Reserve is anxious to avoid, even if that means continuing to hike interest rates higher. The good news is there are many reasons that financial markets see higher inflation coming to an end. In fact, expected average inflation for the next five years as measured by the Treasury breakeven rates has fallen from 3.5% per year in March to about 2.5% per year now. That’s a far cry from June’s 9.1% reading but goes to show that the market is not anticipating high inflation to continue for much longer.

Of course, one could draw similarities to many financial conditions we’ve experienced before to argue for how the economy and your investments may fare in the near future. We think that the markets do a good job of ‘pricing in’ the probabilities that various outcomes will occur, such as peaking inflation or a looming recession, as over $700 billion of trades occur daily (2021 global average) based on new information and best expectations of what will happen. Therefore, rather than focusing time on the hopeless task of predicting the future, we’re at work maintaining a disciplined approach and making strategic (not market timing) changes in conjunction with your long-term financial plan to help you meet your goals.

Investors’ Largest Concern and How to Manage It

And just like that, two years have passed since spring 2020! In our daily lives and in the markets, it has been both rewarding and challenging. There has been a lot – I repeat, a lot – of things outside of our control over these two years.

For most people, it’s hard not to let uncertain and often significant external events influence how we feel about everything else in our lives. Though often necessary over the last two years, I found the time I spent focused on things largely outside my control was frustrating and disheartening. Conversely, I think many people can relate to the inner peace and happiness we can get when we focus on things within our control, spending time doing things that we enjoy with people we love.

Similar in many ways, a focus on the right portfolio composition and personalized financial planning allows Boardwalk and our clients to enjoy the benefits of managing wealth and achieving goals even in the face of external pressures (such as blistering inflation).

Numerous polls show inflation is now the American public’s largest worry. It’s one of the biggest concerns for investors, too, which is why it’s been featured in our commentaries. The April consumer price index (CPI) change over the past 12 months has now spiked to 8.5%, up 1.2% since last month’s reading. The Federal Reserve has embarked on a rate hiking cycle to combat this, with the goal of orchestrating a ‘soft landing’ – where inflation subsides, but unemployment remains low and economic growth continues. There are some indications of the pace of inflation topping out, but there is a long way to go.

While we can’t control market returns over this uncertain period, there are aspects of portfolio management that are within our control as investors. Here are a few examples:

  • Most important is determining the right asset allocation based on your individual circumstances and risk tolerance. The mix of stocks and other risky assets to bonds and less risky assets is the largest driver of both risk and return, regardless of where the market moves. We believe academically driven, globally diversified investing is key to meeting your long-term goals.
  • Ongoing portfolio management such as rebalancing is also within our control. Staying exposed to out-of-favor asset classes is part of this disciplined approach, since rebalancing is in effect trimming recent winners to buy beaten down asset classes. As an example: for years, commodities dragged on performance but have been worth their weight in gold (pun intended) lately as an inflationary hedge and diversifier.
  • We can also optimize tax efficiency by strategically placing assets in certain account types according to their tax characteristics, minimizing turnover in taxable accounts, and managing portfolio withdrawals.

Within the realm of financial planning, cash flow planning and revisiting long-term goals are important ways to address current concerns of inflation and market volatility.

  • Cash flow planning: as costs rise for retired clients, increasing portfolio withdrawals (tax efficiently) is often necessary when inflows don’t match higher spending needs. For everyone, budgeting can also become more important as the same dollars need to be stretched. We help you think about proper cash reserves too, so that you can rest assured important goals can be met while minimizing cash on the sidelines being eaten away by inflation.
  • Long-term projections: revisiting your long-term plan keeps you aware of how you’re progressing towards your goals. As things change – including higher spending needs – we adjust our projections and can model scenarios that show persistently high inflation relative to a long-run inflation assumption. There’s comfort in knowing how market volatility, higher inflation, and personal changes impact your ability to meet your long-term goals and whether any current adjustments need to be made to help align your financial picture to your vision.

With market uncertainty and inflationary concerns mounting, lean on us to provide peace of mind or a course correction to help you stay disciplined and on track to meet your goals.

Whistling Happy Tunes in 2021

For much of 2021 it seemed like investors were just whistling “Walkin’ in the Sunshine” by Roger Miller and quickly forgetting the ‘worries and woes’ of the pandemic, inflation, the Fed, geopolitics and a host of other concerns. At least here in the US, 2021’s risk-on attitude didn’t let up for more than a few trading days at a time! Heading into a new year, there’s a general sense of shifting winds. So, let’s talk about 1) market highs, 2) valuation differences within the stock market, and 3) inflation. We’re here to walk with you through all that 2022 could bring and help you stay focused on the long-term trajectory of your financial plan.

Market Highs

You know it’s been a great year when the S&P 500 hits 70 new all-time highs! That’s the second most in S&P 500 history, only behind 1995’s 77 new highs. (This won’t be the last time the bull market of the 1990’s comes up.) Rising markets elicit both investor pleasure and anxiety. To quote DFA VP Weston Wellington’s year end commentary, investors “may be reluctant to make new purchases since the traditional ‘buy low, sell high’ mantra suggests committing funds to stocks at an all-time high is a surefire recipe for disappointment.” As he points out in the chart below, history would suggest otherwise:

Surprising? Rationally though, this makes sense since stock prices have increased over time and therefore new market highs must be reached on a consistent basis. Investors provide capital to companies with the expectation of positive returns over time. Whether it’s amid a recession or after an incredible rally, that long-run expectation remains the same. Our advice is to get new cash working for you in the markets as fast as you’re comfortable with, and to focus on the long-term results of diversified investing rather than short-term volatility.

Valuation Differences Within the US Stock Market

Hitting new all-time highs so frequently brings up another question: is the entire US stock market at a “lofty” stage, as some would say, or are there areas within the market with dramatically different valuations? According to most financial measurements, value-style stocks are reasonably priced verses historical averages. Depending on the valuation metric, US growth stocks have eclipsed their tech bubble highs. This is shown below in the price-to-book chart put together by Dimensional Fund Advisors.

When looking at this price-to-book chart, the spread (difference) between the lines is the key takeaway. Growth stocks always trade at higher multiples (the yellow line never crosses below the blue one). This is because investors are willing to pay more for companies with strong revenue and profit potential. Conversely, value-style stocks are usually “on sale” for a reason – they’re riskier. That extra risk has historically been compensated with higher returns. It’s difficult to predict when styles go in or out of favor and nearly impossible to predict it consistently across market cycles. Nevertheless, mean reversion is a powerful force and it’s unlikely that a growing valuation spread can continue indefinitely.

At Boardwalk, we recommend holding both growth and value stocks but incorporating a tilt away from growth stocks and towards value stocks due to their expected excess return over the market at any time, not just because of their current valuation spread.

Inflation

The December inflation data was recently published and shortly dominated financial headlines everywhere. Up 7% from one year ago, it’s the largest Consumer Price Index (CPI) bump since 1982. Alarming for all investors, we featured an in-depth spotlight on inflation during our last quarterly commentary and wanted to provide a few key updates.

First, equities are the best long run hedge against inflation even if prices reflect investors’ jitteriness in the short-term. Stocks handily beat this year’s inflation figures. Additionally, we include commodities (+27.1%) and global real estate (32.5%) in portfolios, in part due to their inflation hedging characteristics.

Second, this chart from Morningstar is helpful for describing the nature of today’s inflationary environment. This data shows month-over-month inflation in excess of the pre-pandemic trends.

The combination of supply chain issues, rising labor and production costs, and high consumer demand are all contributing to rising prices. But much of the large inflation adjustments are coming from a few select categories like “vehicles,” above. Higher automobile prices account for about half of the excess inflation we’re seeing, which gives hope of much lower inflation figures once supply chain issues are resolved in that industry (and others).Third, the bond market is expecting a return to “normal” inflation levels relatively quickly. While inflation proved to be stickier than the Fed’s initially projected “transitory” stance, market participants have priced in only moderately higher inflation over 5 and 10 years than pre-pandemic. This can be ascertained by calculating the difference between the nominal Treasury yield and the Treasury Inflation Protected Securities yield. This difference is called the “break-even rate.” The 5-year break-even rate (read: expectation for inflation) is just under 3%, compared to just under 2% in January 2020. The 10-year break-even rate is at 2.5% right now. There is no guarantee the collective expectation will prove to be right, but it’s a comforting piece of information given today’s headlines.

We’re here to help you better understand what’s going on in your portfolio and to steer you toward a long-term focus. Come what may in the markets, lean on us to help you translate your ideal goals into financial plans that make sense for you (and to you).

Can Inflation be a Good Thing?

When it comes to inflation, a small amount of it is healthy for the economy. That’s because when consumers and businesses expect prices to continue rising, they are more likely to buy something today. Strong current demand spurs growth on the supply side of the economy since businesses expand their workforces and production to meet this demand. As you can see, low and consistent inflation creates a virtuous cycle that is good for economic growth. In fact, the opposite scenario – deflation – would likely be more problematic than moderate inflation. The US Federal Reserve has set a target of 2% for core inflation with the duel aim of avoiding deflation or high inflation.

As we transition ‘back to normal’ there has been high consumer demand, massive governmental stimulus, supply chain issues, and global shortages of raw and manufactured goods. The Federal Reserve anticipates that most of these inflationary forces will abate. Caught between managing inflation and spurring growth, they’ve emphasized their goal of bringing employment back to pre-pandemic levels. If inflation proves to be less transitory than most economists expect, the Federal Reserve will likely take steps such as raising interest rates to avoid overheating the economy.

Inflation becomes dangerous when it causes too much growth and prices rise faster than wages, with everyone worse off in terms of purchasing power. To help counteract this effect for many retirees, the Social Security Administration bumped benefits for 2022 by 5.9% (compared to an annual average adjustment of 1.65% over the last decade)! For wage earners, incomes have and should continue to rise. So, for most clients there is a good amount of insulation against inflation via higher cash inflows. We also recommend appropriate cash reserves since cash is very susceptible to inflation. The inflation-adjusted ‘return’ of cash is virtually guaranteed to be negative. The risk of losing purchasing power can be mitigated through long-term, thoughtful investments and cash flow planning.

When it comes to the portfolio, we’ve designed the investment allocations with risks – like inflation – in mind.

  • Stocks typically hold up well against inflation in the long-term because companies can pass higher costs along to consumers. The bulk of most client portfolios are invested in US, developed international, and emerging market equities.
  • Bond returns may be muted or negative on a “real” (inflation-adjusted) basis in an inflationary scenario. This is especially true if interest rates rise – which is likely if the Federal Reserve deems it necessary to rein in inflation.
    • We have positioned portfolios with a healthy allocation to short-term bonds to diminish this risk. Shorter maturity bonds are less impacted by rising interest rates because they mature more frequently and can reinvest into higher interest rates.
    • We also avoid any allocation to long-term bonds right now because those would be most significantly hurt by rising interest rates. Yields at those maturities are not compelling enough for this large risk.
  • Commodities and real estate are “hard assets” that should do well in an inflationary scenario.
    • Real estate investments provide a hedge due to land scarcity and because rents tend to adjust with inflation, providing income protection.
    • Commodities have been the best performing asset class this year in part due to inflationary factors. While a laggard in the low yield and low inflation environment of the late 2010s, commodity funds have done well as an investment because prices for goods as far ranging as copper, lumber, and crude oil have all risen considerably this year.

No one knows which portfolio risk will present itself next, so we want to stress the importance of remaining diversified and disciplined in achieving long-term investing success.  If you have any questions or concerns about the positioning of your portfolio, let’s discuss it at your earliest convenience.

The Cost of Timing the Market

Markets have come down a bit from all-time highs, but the S&P 500 index is still up over 17% this year. Since March 23rd of 2020, the S&P 500 is up over 55%! For all investors, intense rallies like this beg the questions:

  • Is now a good time to put cash to work, or should I wait until the next correction?
  • Should I be trimming my winners by selling stocks and buying bonds?
  • I’m not sure the market or economy can keep this up and there are a lot of risks out there for the next year and even next decade, should I change my strategic allocation to hold fewer equities?
  • Or maybe: I know people who talk about their big gains and I don’t want to miss out – should I be changing my portfolio so that I can participate more in this exciting rally?

These are good questions to be asking. We want to talk with you about your feelings towards the market’s rally and future expectations. More importantly, we want to talk with you about how that fits into your risk tolerance, protecting your current needs, and meeting your future goals.

Many times, at the essence of these questions lies the concept of market timing – predicting when to enter and exit stocks, bonds, and cash as various investments experience rallies and corrections. The fact is, timing the market is extremely difficult.

Even missing just a few of the best days in a market rally has an enormous impact on an investor’s returns. Here are some stunning statistics put together by Dimensional Fund Advisors:

As we can see, missing the best 15 days of S&P 500 returns in the last 30 years would result in about one-third as much ending wealth!

Short periods of time “out of the market” could have huge opportunity costs, and it’s extremely difficult to accurately and consistently time entries and exits from the market. For example, someone might have seen the early declines of February 2020 and sold their stocks – correctly predicting that further losses were yet to come. But without a quick reentry, they would have been far better off to simply “ride out” the market correction and fully participate in the speedy recovery. Similarly, an investor today might leave cash on the sidelines, predicting an upcoming correction. If the market continues to rise, it often becomes harder to abandon the cash position, fearful of “buying high.” Many investors experience this ‘paralysis’ and miss out on the growth that disciplined, long-term investors receive.

On Monday, there was a great article on Morningstar that highlighted the long-term returns of market timing by professionals. Mutual funds with this focus are known as tactical asset allocation funds, and they’ve lagged their benchmarks significantly. Quite simply, it’s just hard to predict the future!

At Boardwalk, we believe in the importance of discussing our clients’ needs, goals, risk tolerance, and emotions when making investment choices and we use robust empirical findings to help clients be comfortable with their portfolio and confident in their decisions.


Investing Lessons From the Birthday Paradox

I was recently with a group of friends, and we were astonished to learn that two pairs of us had shared birthdays – out of 10 people! We were all blown away by this and assumed that the likelihood of even one pair of us having a matching birthday would be close to zero. Naturally, we turned to Google rather than our calculators, and found that a matching birthday is not nearly as rare as you would imagine. With just 10 people, there is over an 11% chance that two people will share a birthday! Perhaps even more surprisingly, the odds that two people will share a birthday are better than a coin flip within a group of 23 people and essentially guaranteed with a random group of 57! This “phenomenon” is known as the Birthday Paradox because it seems counterintuitive. But it started to be less surprising after reading about it.

Rather than thinking about the odds of getting a specific date (out of 365) to match, we need to consider the pairs of individuals present – because each person needs to be paired up against every other person in the group to see if they share a birthday. As an example, with two people there is only one pair (and very low odds of a birthday match). But with 10 people, there are 45 pairs! The number of pairs grow so quickly that with 57 individuals there are 1,596 pairs – hence the almost certain probability of a match.

Our brains have an extremely difficult time understanding this, because probabilistic and exponential calculations are not how we usually think about the world, birthdays, or money.

But perhaps they should be – even if we cannot wrap our minds around it fully! Thomas Edison’s quote, “The strongest force in the universe is compound interest,” is surprising in the same way that the Birthday Paradox catches our mind off guard. We’ve all heard the question: Would you rather have $1,000,000 today or a single penny that doubles in value each day for 30 days? And the answer…the power of compound interest is exhibited by the $5,368,709.12 you would have after a month if you opted for the penny.

Getting our minds to consider the world like this can be difficult, but it is important when it comes to investing.

To me, the lessons from the Birthday Paradox can be applied to market pricing efficiency. In liquid, transparent markets, pairs consisting of buyers and sellers trade constantly based on current information and their best future expectations. If only a few trades occurred for a stock, the odds of finding the “right price” may be low. But for markets like the S&P 500, there have been between 4-10 billion trades each day over the first three months of the year according to S&P Global Market Intelligence. Everyone is trying to assess the value of those 500 stocks, every day. And while there are certainly instances where individual stocks do not seem to trade “normally,” the market as a whole is very efficient in finding the matching price to value a company. New information and even expectations of future developments (like the odds of the next inflation reading being higher or lower than expected) are constantly assimilated into the price. This makes it very difficult to consistently outsmart the market through stock picking or market timing.

If you can’t beat ‘em, join ‘em! Despite the difficulty our brains have in understanding probabilities and exponential functions, we can still use them as we participate in the stock market. Taking Edison’s advice, saving earlier and often results in greater wealth down the road as we use compound growth to our advantage. And considering market efficiency, usually the best way to invest for the long-term is through more passive investment approaches and investing excess cash right away – because while no one knows what the future holds, our collective best guess is already “priced in.” The fruits of disciplined investing are not seen every week, month, quarter, or year, but over time will serve you well.

Do I Need a Will? What About Life Insurance?

Estate planning and personal risk management are usually not dinner table topics. And if there is going to be a conversation about personal finance among friends and family, these days a betting person would guess Dogecoin or AMC’s stock price would come up before wills or life insurance. That’s okay, they certainly are more interesting! But just because something is not interesting doesn’t mean it’s not very important. The information below is definitely less interesting than the GameStop stock drama, yet it is important to the financial wellness of your family.

Estate planning can get complex very quickly. While it is important to get a professional involved to determine what level of estate planning is appropriate, a basic “Last Will and Testament” document is typically a great start for every adult to have. So why do you, your family members, and friends need a will? A will ensures that property and assets get distributed according to your wishes. This distribution is done by a person of your choosing (the executor of your estate). Additionally, your named guardians will be responsible for your children. Without a written and legal will, a court process governed by state law determines who inherits assets and who raises children. This legal process is usually far more expensive and time consuming than setting up an estate plan. If you are married or have children, you certainly need a will. Even if someone is single and without dependents, they should strongly consider having a will if they have a positive net worth. A will eases the estate transfer process, reduces the potential for conflict among family members, and eliminates “room for error” in court interpretation.

So, what about life insurance – do we need that? Most of us also avoid talking about life insurance (or at least procrastinate on getting it)! According to Business Insider, that leaves more than two-thirds of Americans underinsured, despite a majority having some coverage. The key distinction here is whether merely having some life insurance is fine – and for those that need it, the answer is usually no. Basic coverage through an employer usually does not go very far when replacing an income, paying for childcare, or funding bigger goals like paying off the mortgage or funding a college education. As personal savings grow, children become adults, and retirement nears, life insurance can become less important or even unnecessary. Every situation is unique, but most people with dependents should get professional guidance from an independent financial advisor to ensure they have adequate coverage. The good news is that term life insurance can be very affordable, unlike whole life insurance and other complex policies. Whole life policies remain in place through a policyholder’s lifetime and pay a benefit at death, but these can be very expensive and provide coverage long after it is no longer needed. Term insurance is in place for a set period (such as 20 or 30 years) and only provides a benefit if someone passes away during that time. It is meant to act like true insurance – protecting your loved ones against an untimely death, when lost income during working years and inadequate savings could severely impact their financial wellbeing.

Here are Boardwalk, we believe in financial planning because our choices beyond the portfolio have large impacts – financial and otherwise! Actionable steps in estate planning and personal risk management have controllable outcomes (unlike the markets) and the feedback we have received from our clients demonstrates the peace of mind and financial benefits of proper planning. We encourage everyone to seek out quality, independent advice to ensure they have adequate life insurance coverage and estate planning in place.­­­